

☰

 INI Microstructural
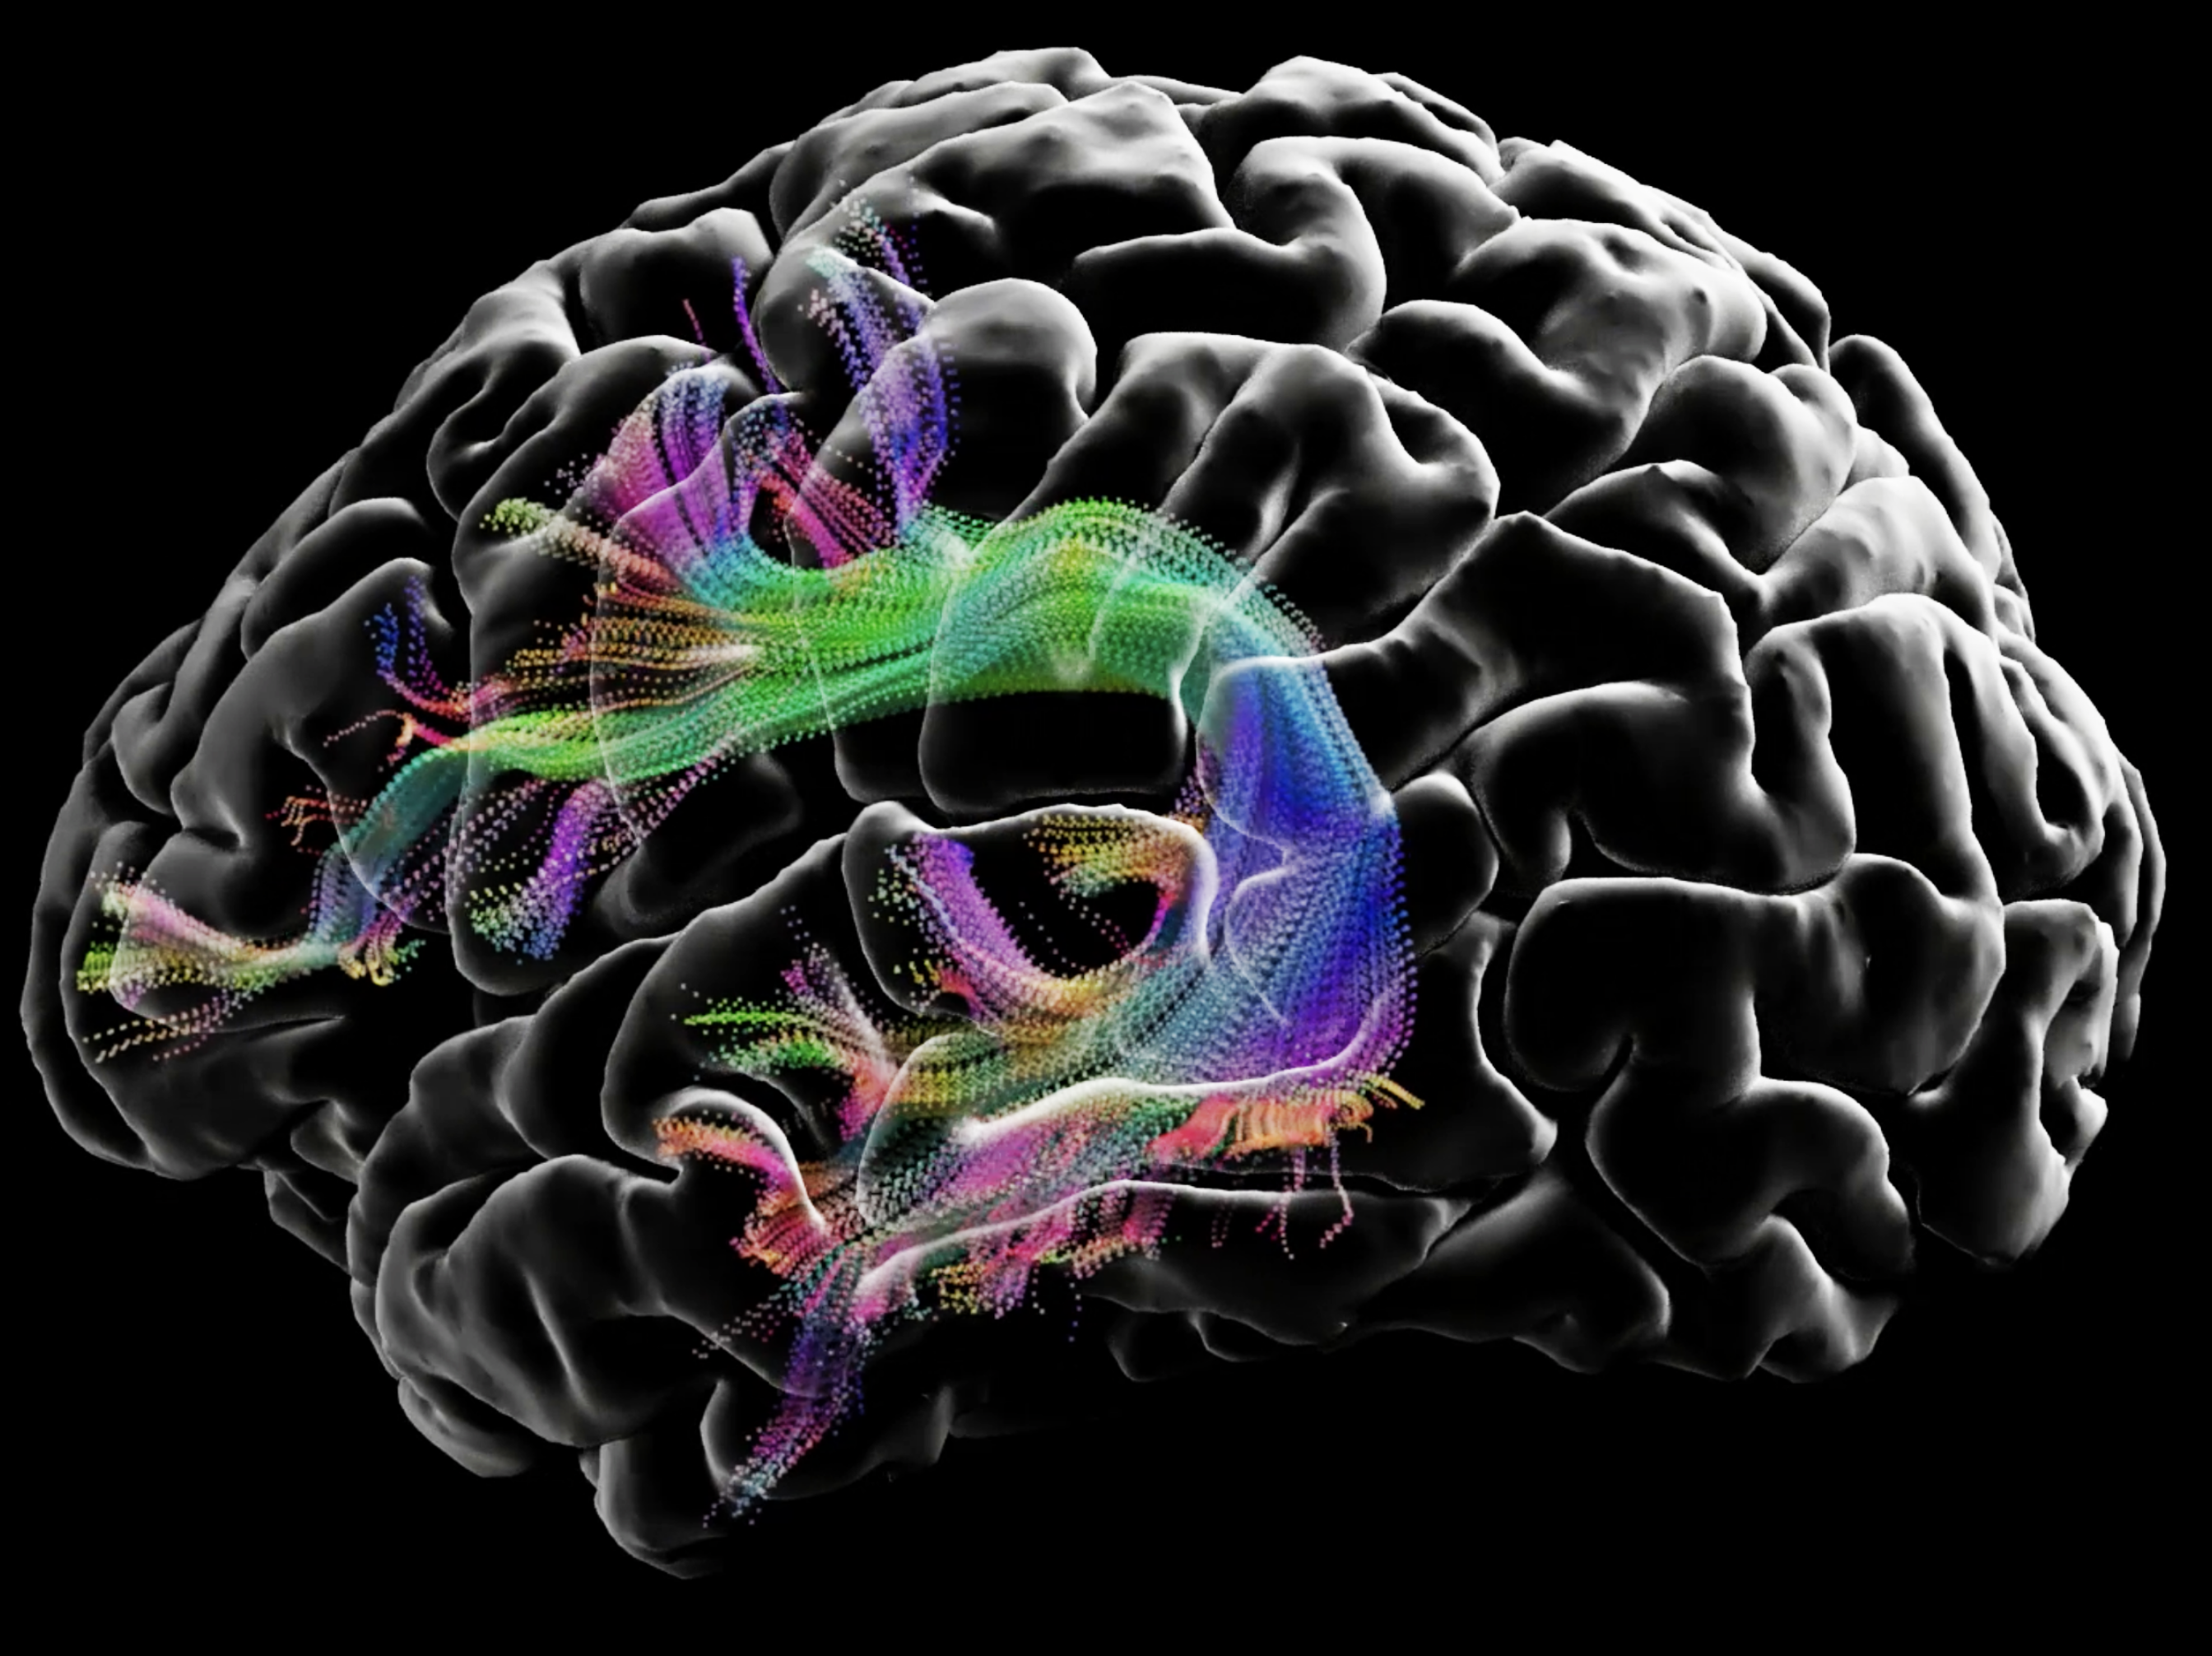
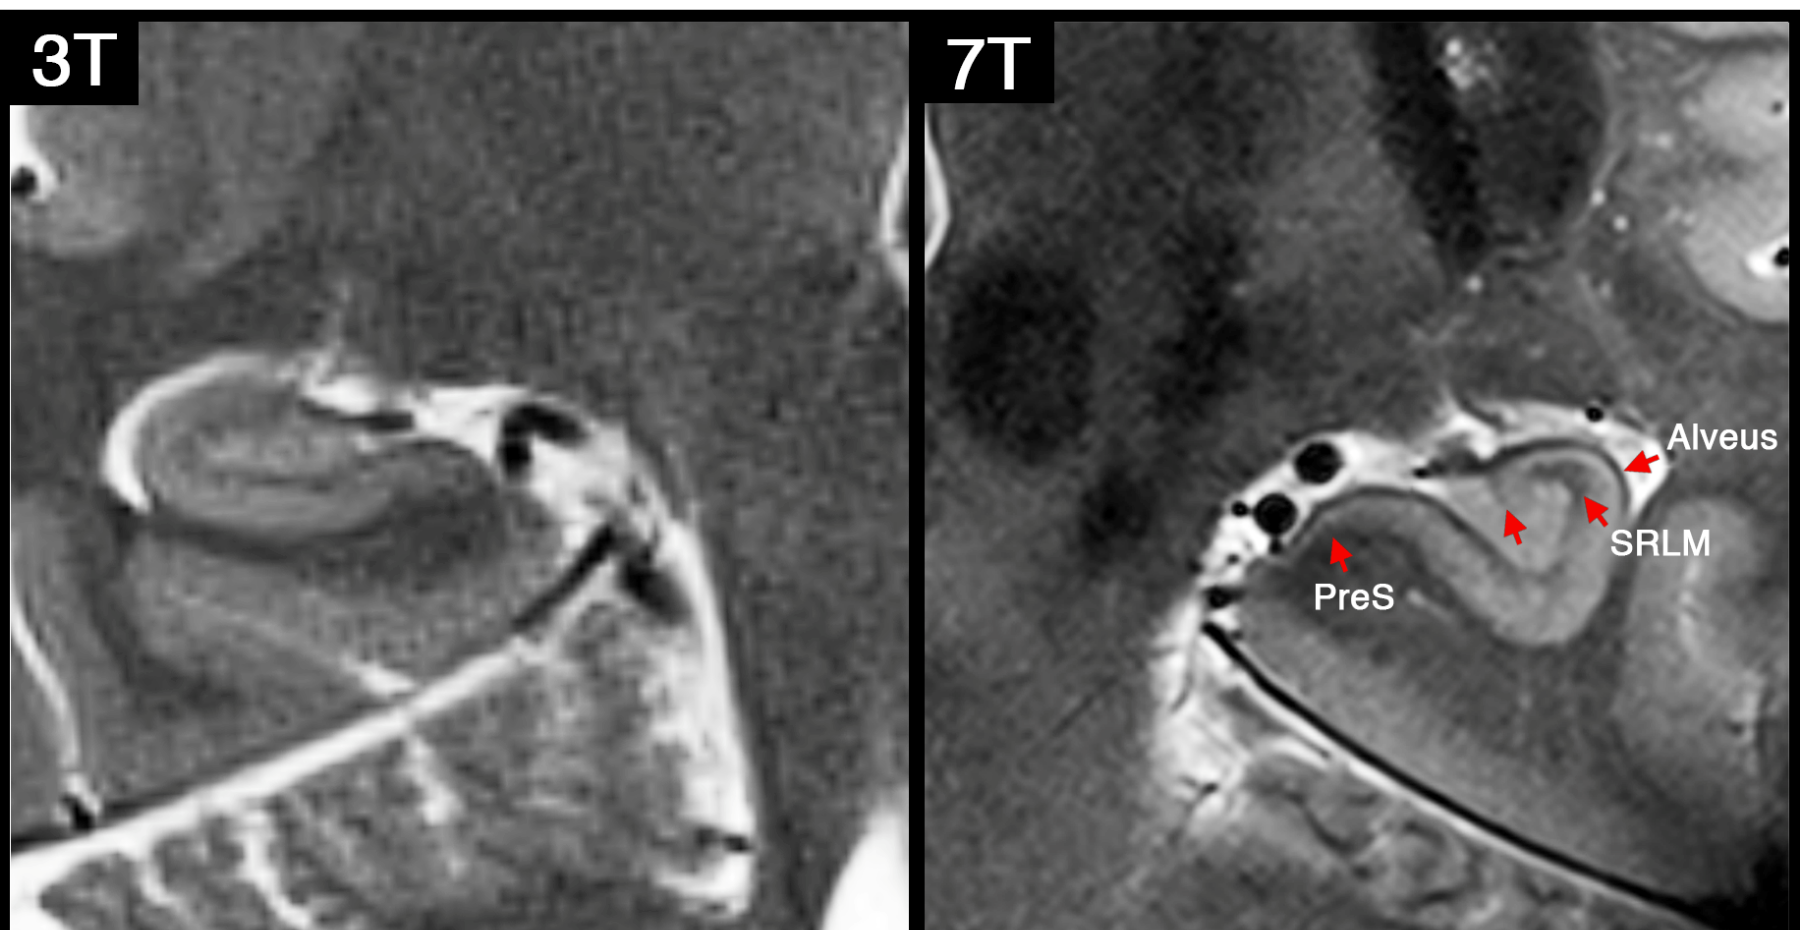
Left: T2-weighted image of hippocampus acquired at 3T MRI (in-plane resolution: 0.4 mm2). This mimics ADNI3 high-resolution hippocampus protocol.
Right: T2-weighted image of hippocampus acquired at 7T MRI (in-plane resolution: 0.15mm2). Note that at 7T we were able to resolve many small sub-regions including: endfolial pathway and rostral CA3, Alveus, layers of prosubiculum and the stratum radiatum lacunosum moleculare (SRLM).
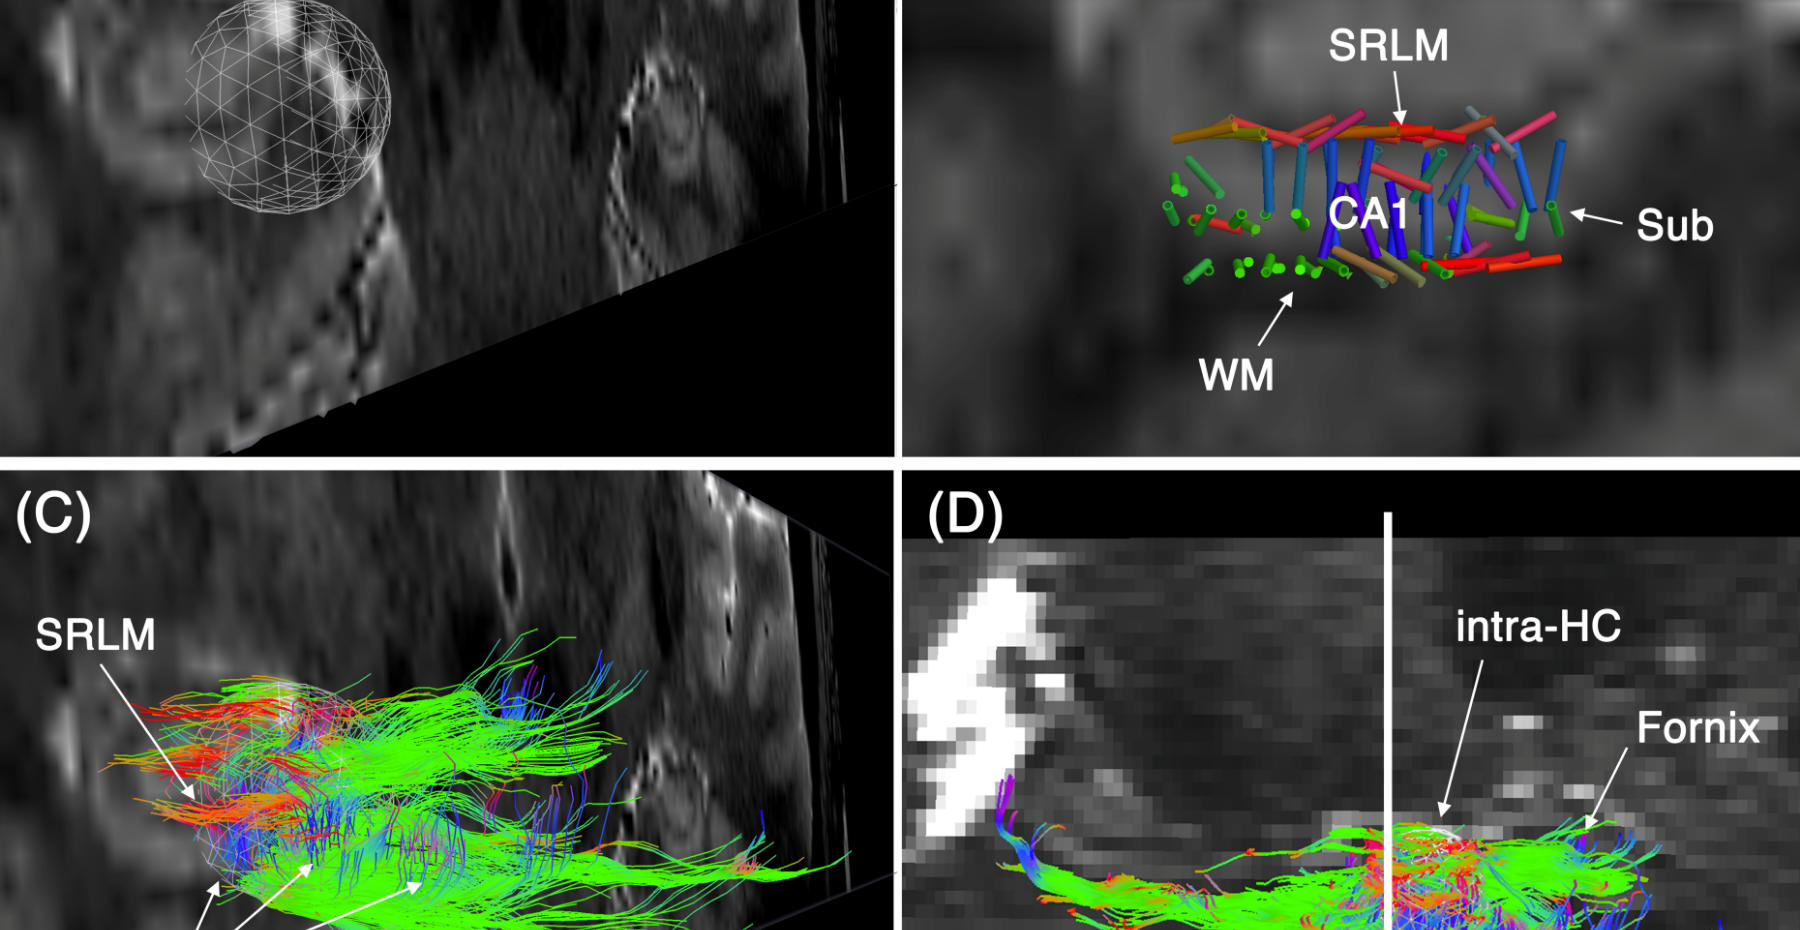
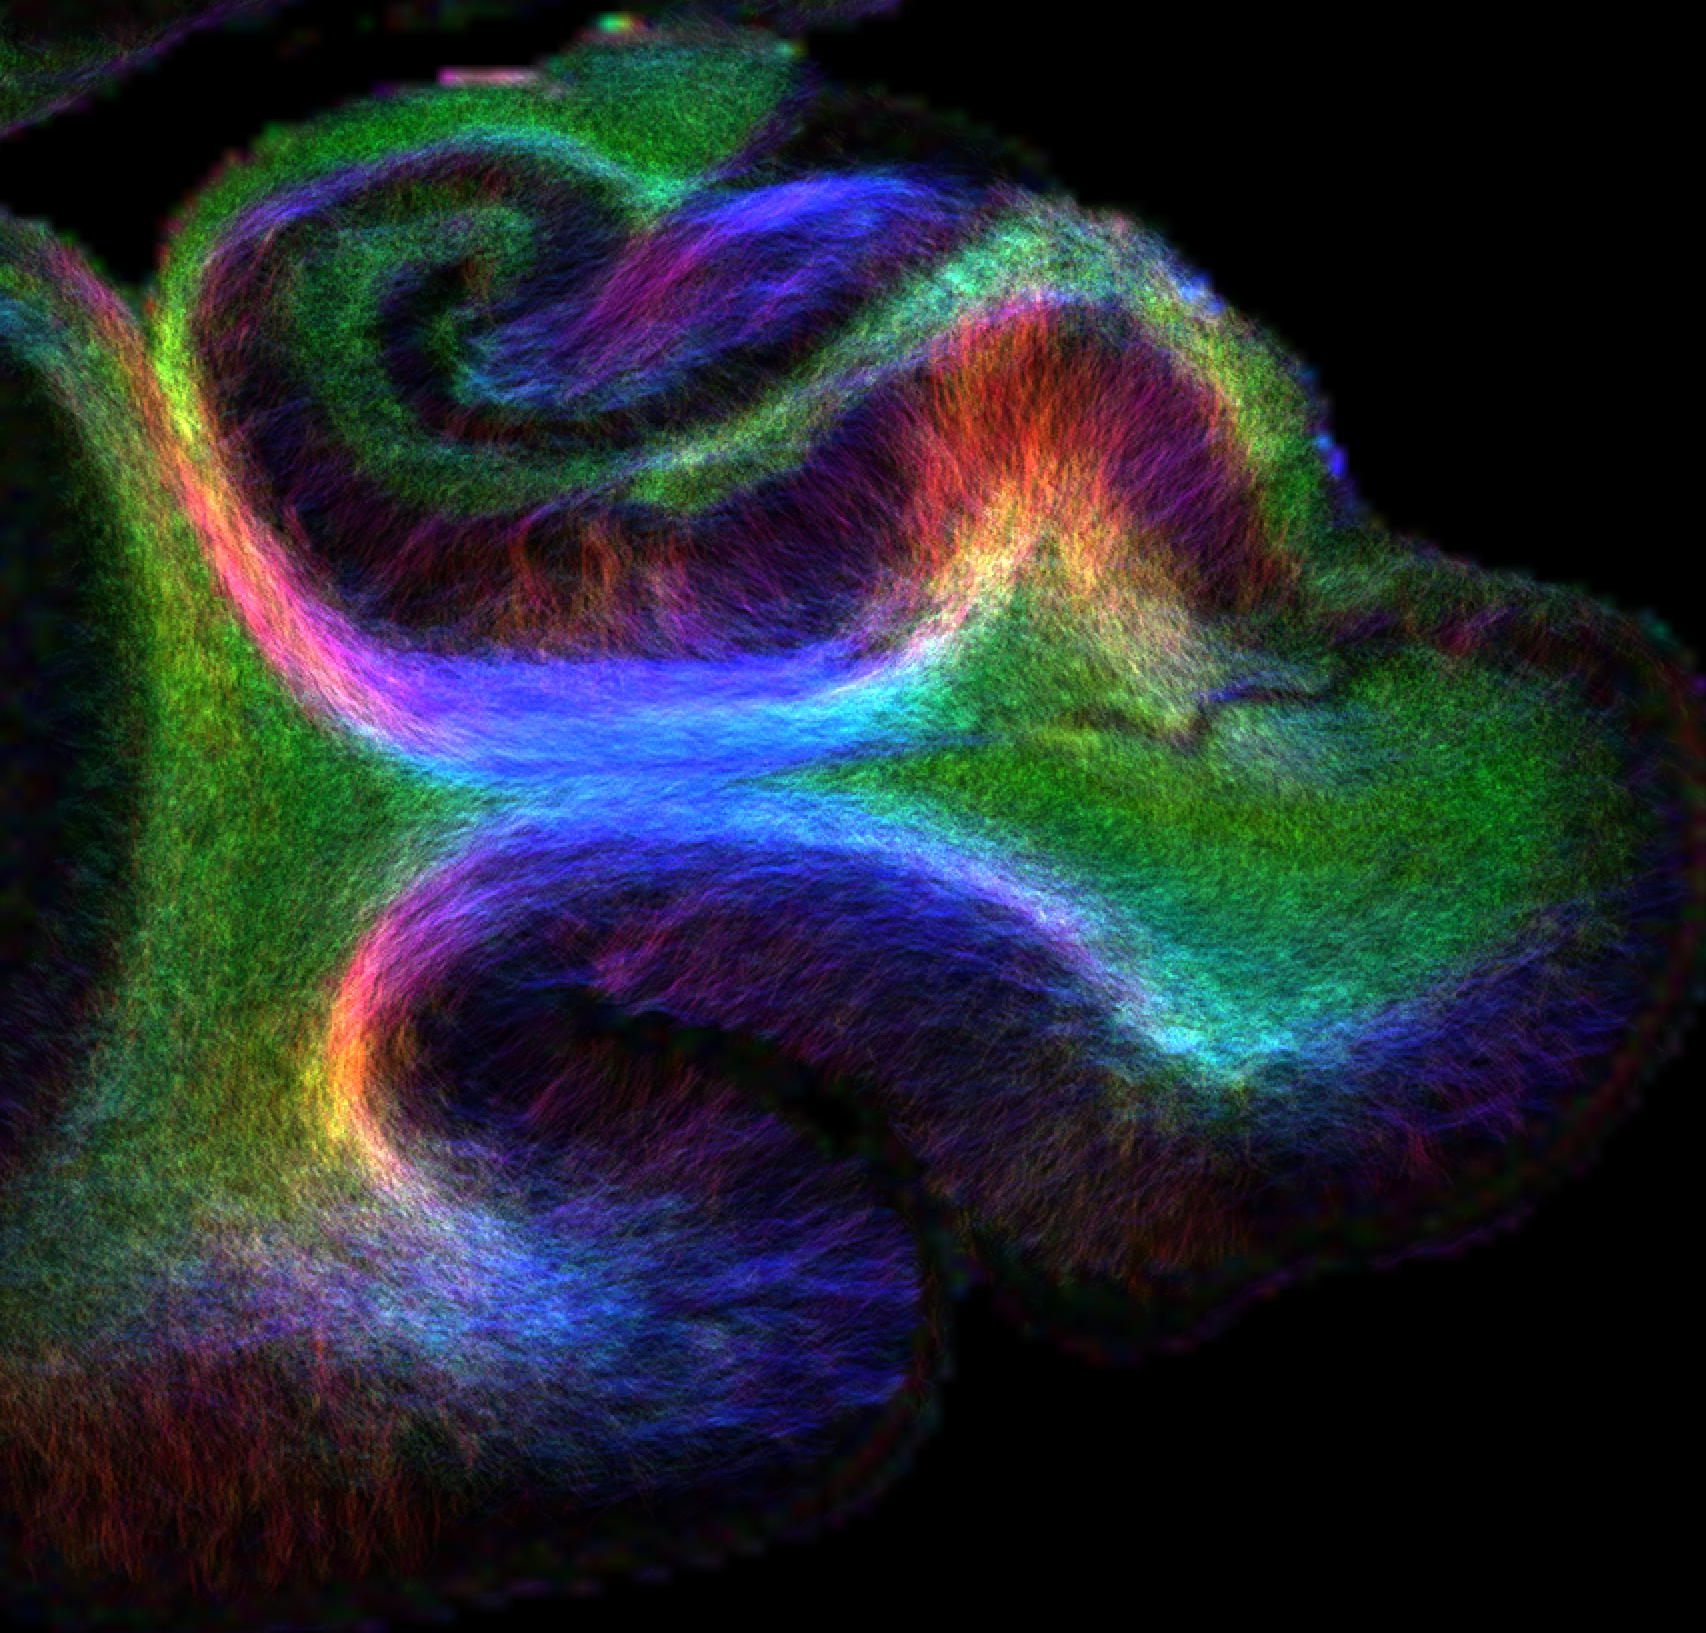
We developed a novel 7T framework that enables high-resolution intra-hippocampal macro-structural and network diffusion imaging. Here we take advantage of 7T MRI technology, readout segmented diffusion MRI and a robust SNR enhancement technique, to enable diffusion MRI of the hippocampal network at 600 m3 isotropic resolution. We achieve a resolution that is 37 times higher than clinical sequences (2mm3) and 4.7 times higher than human connectome project 7T data.
High-resolution MRI image of a healthy adult scanned using 7T scanner at USC Stevens Neuroimaging and Informatics Institute. The video highlights the significant presence of perivascular space fluid (the white strands) throughout the brain.
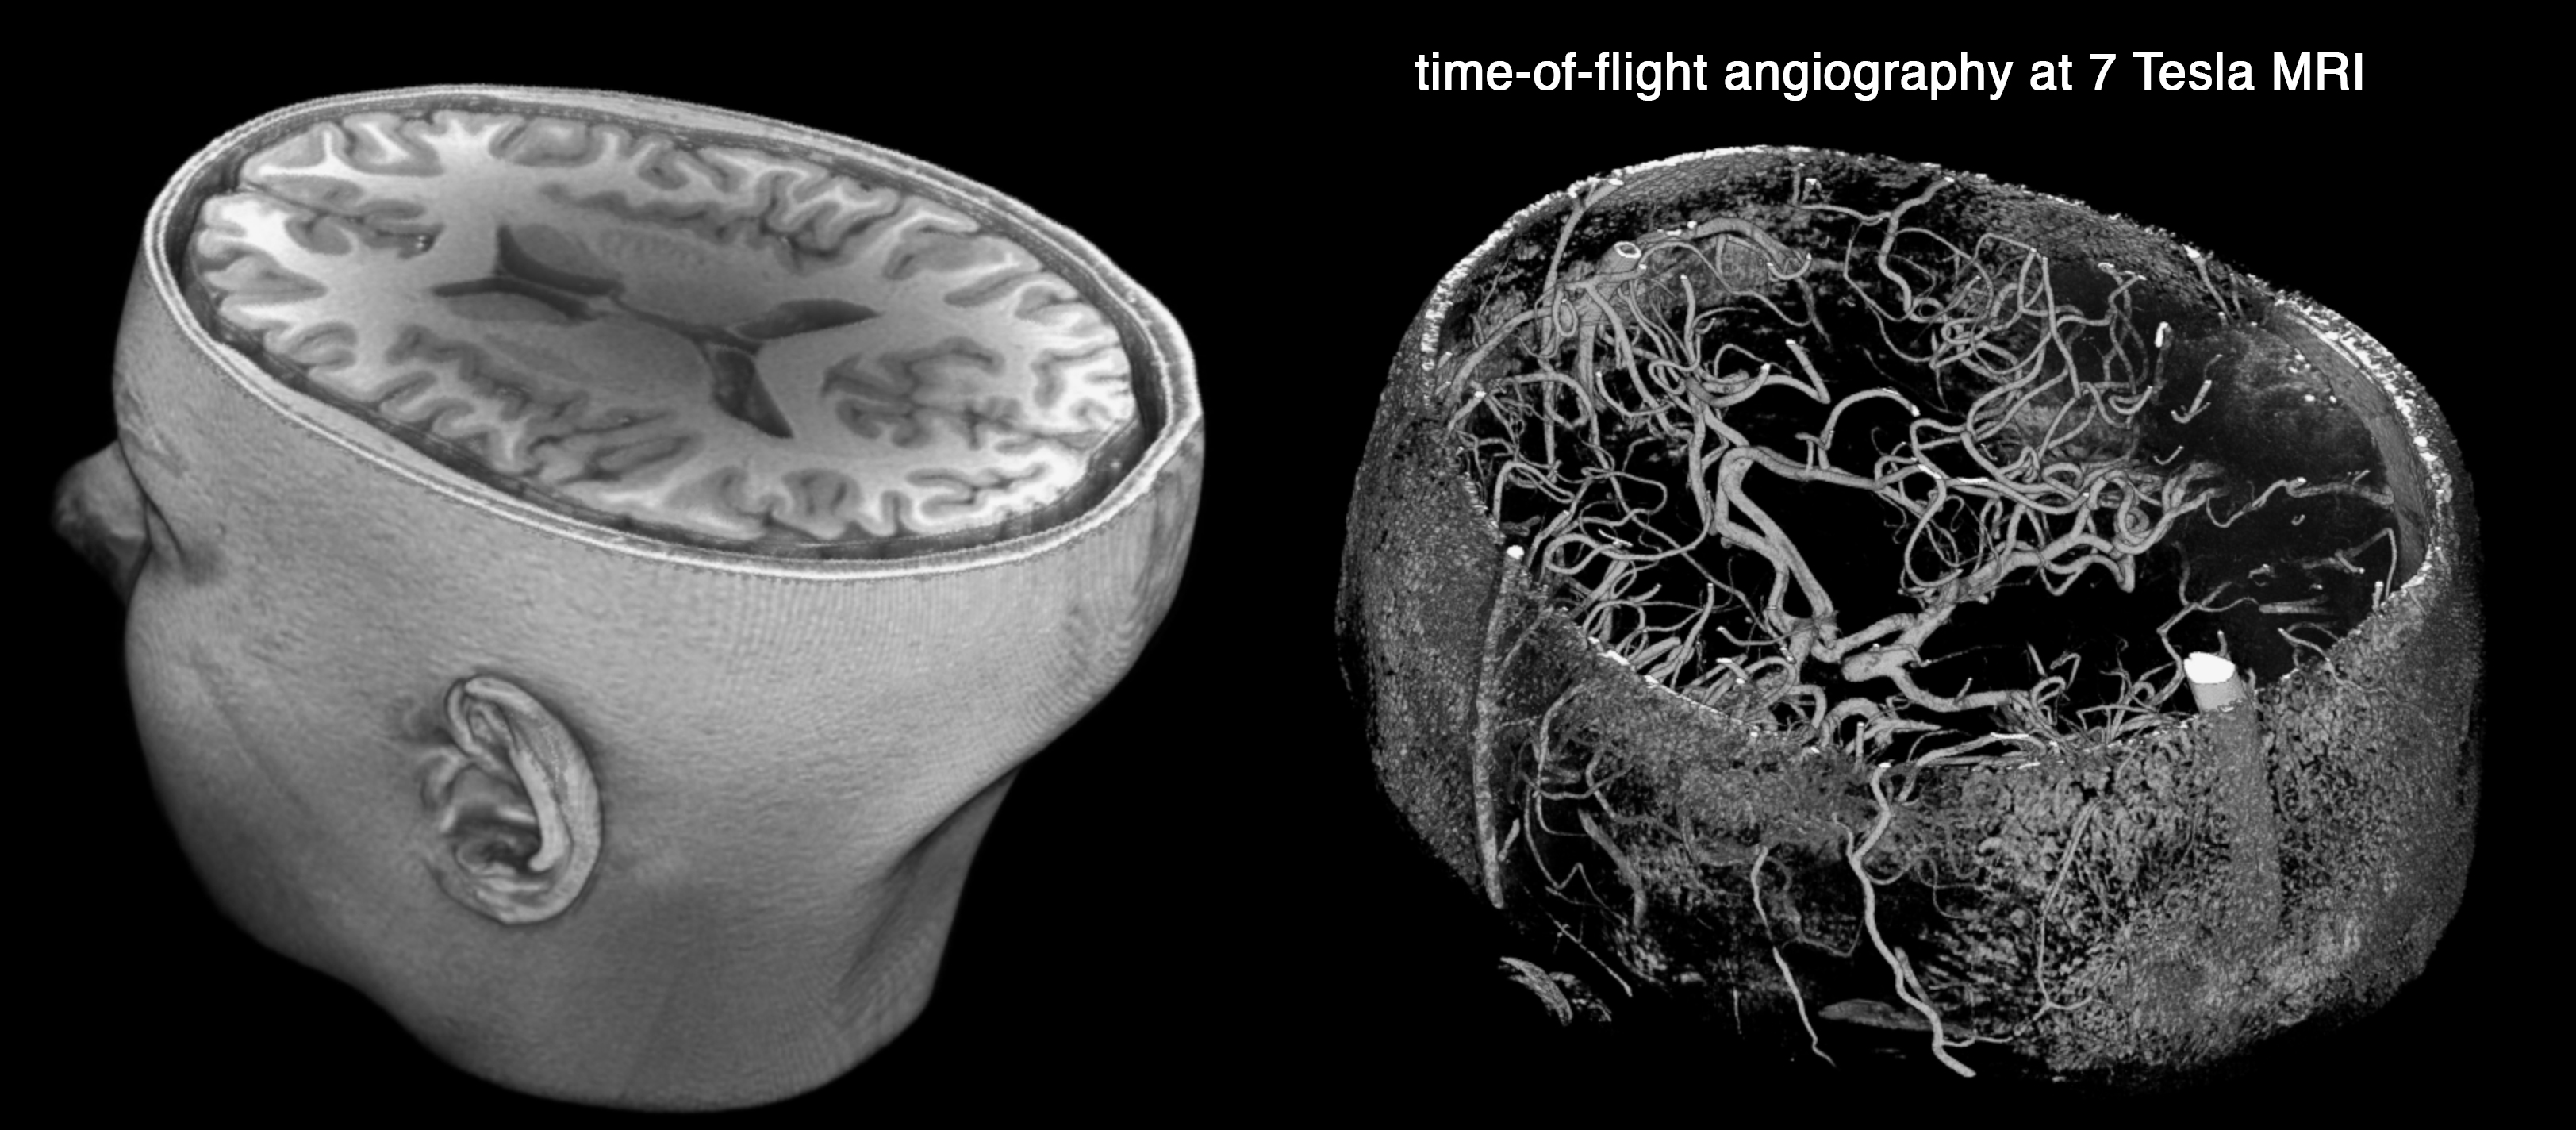
A 3D render of the brain MRI is shown on top. Bottom image shows a map of time-of-flight magnetic resonance angiography, which is an MRI technique to image blood flow without the need to administer contrast. One of the main applications of this modality is in the diagnosis of the intracranial aneurysms.
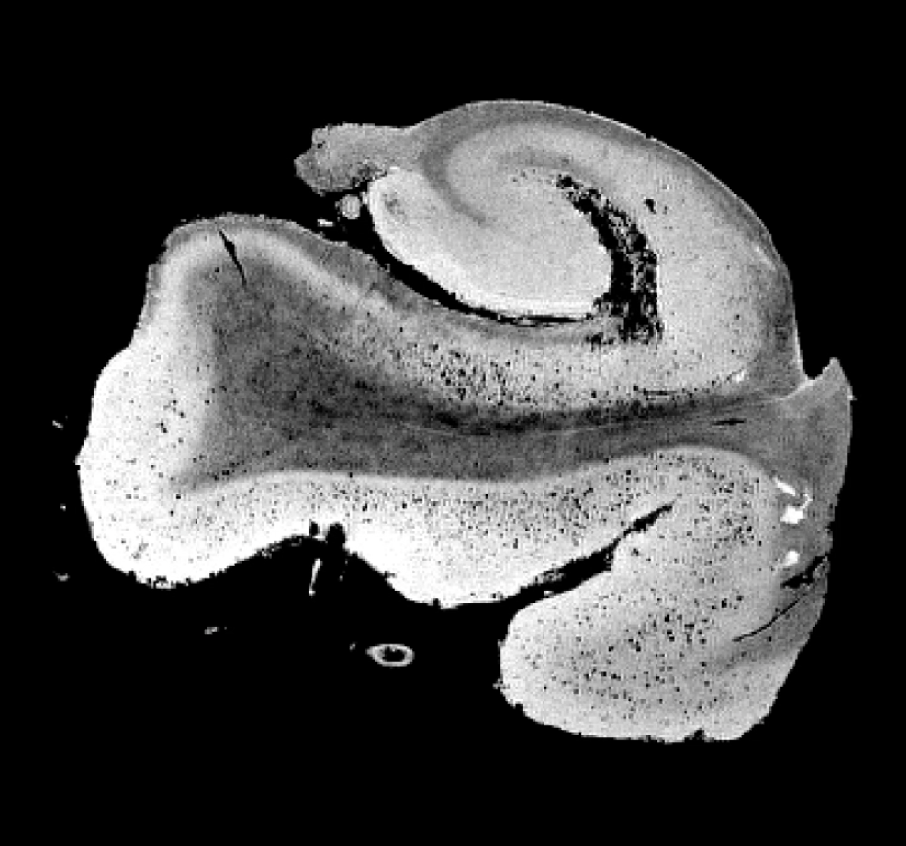
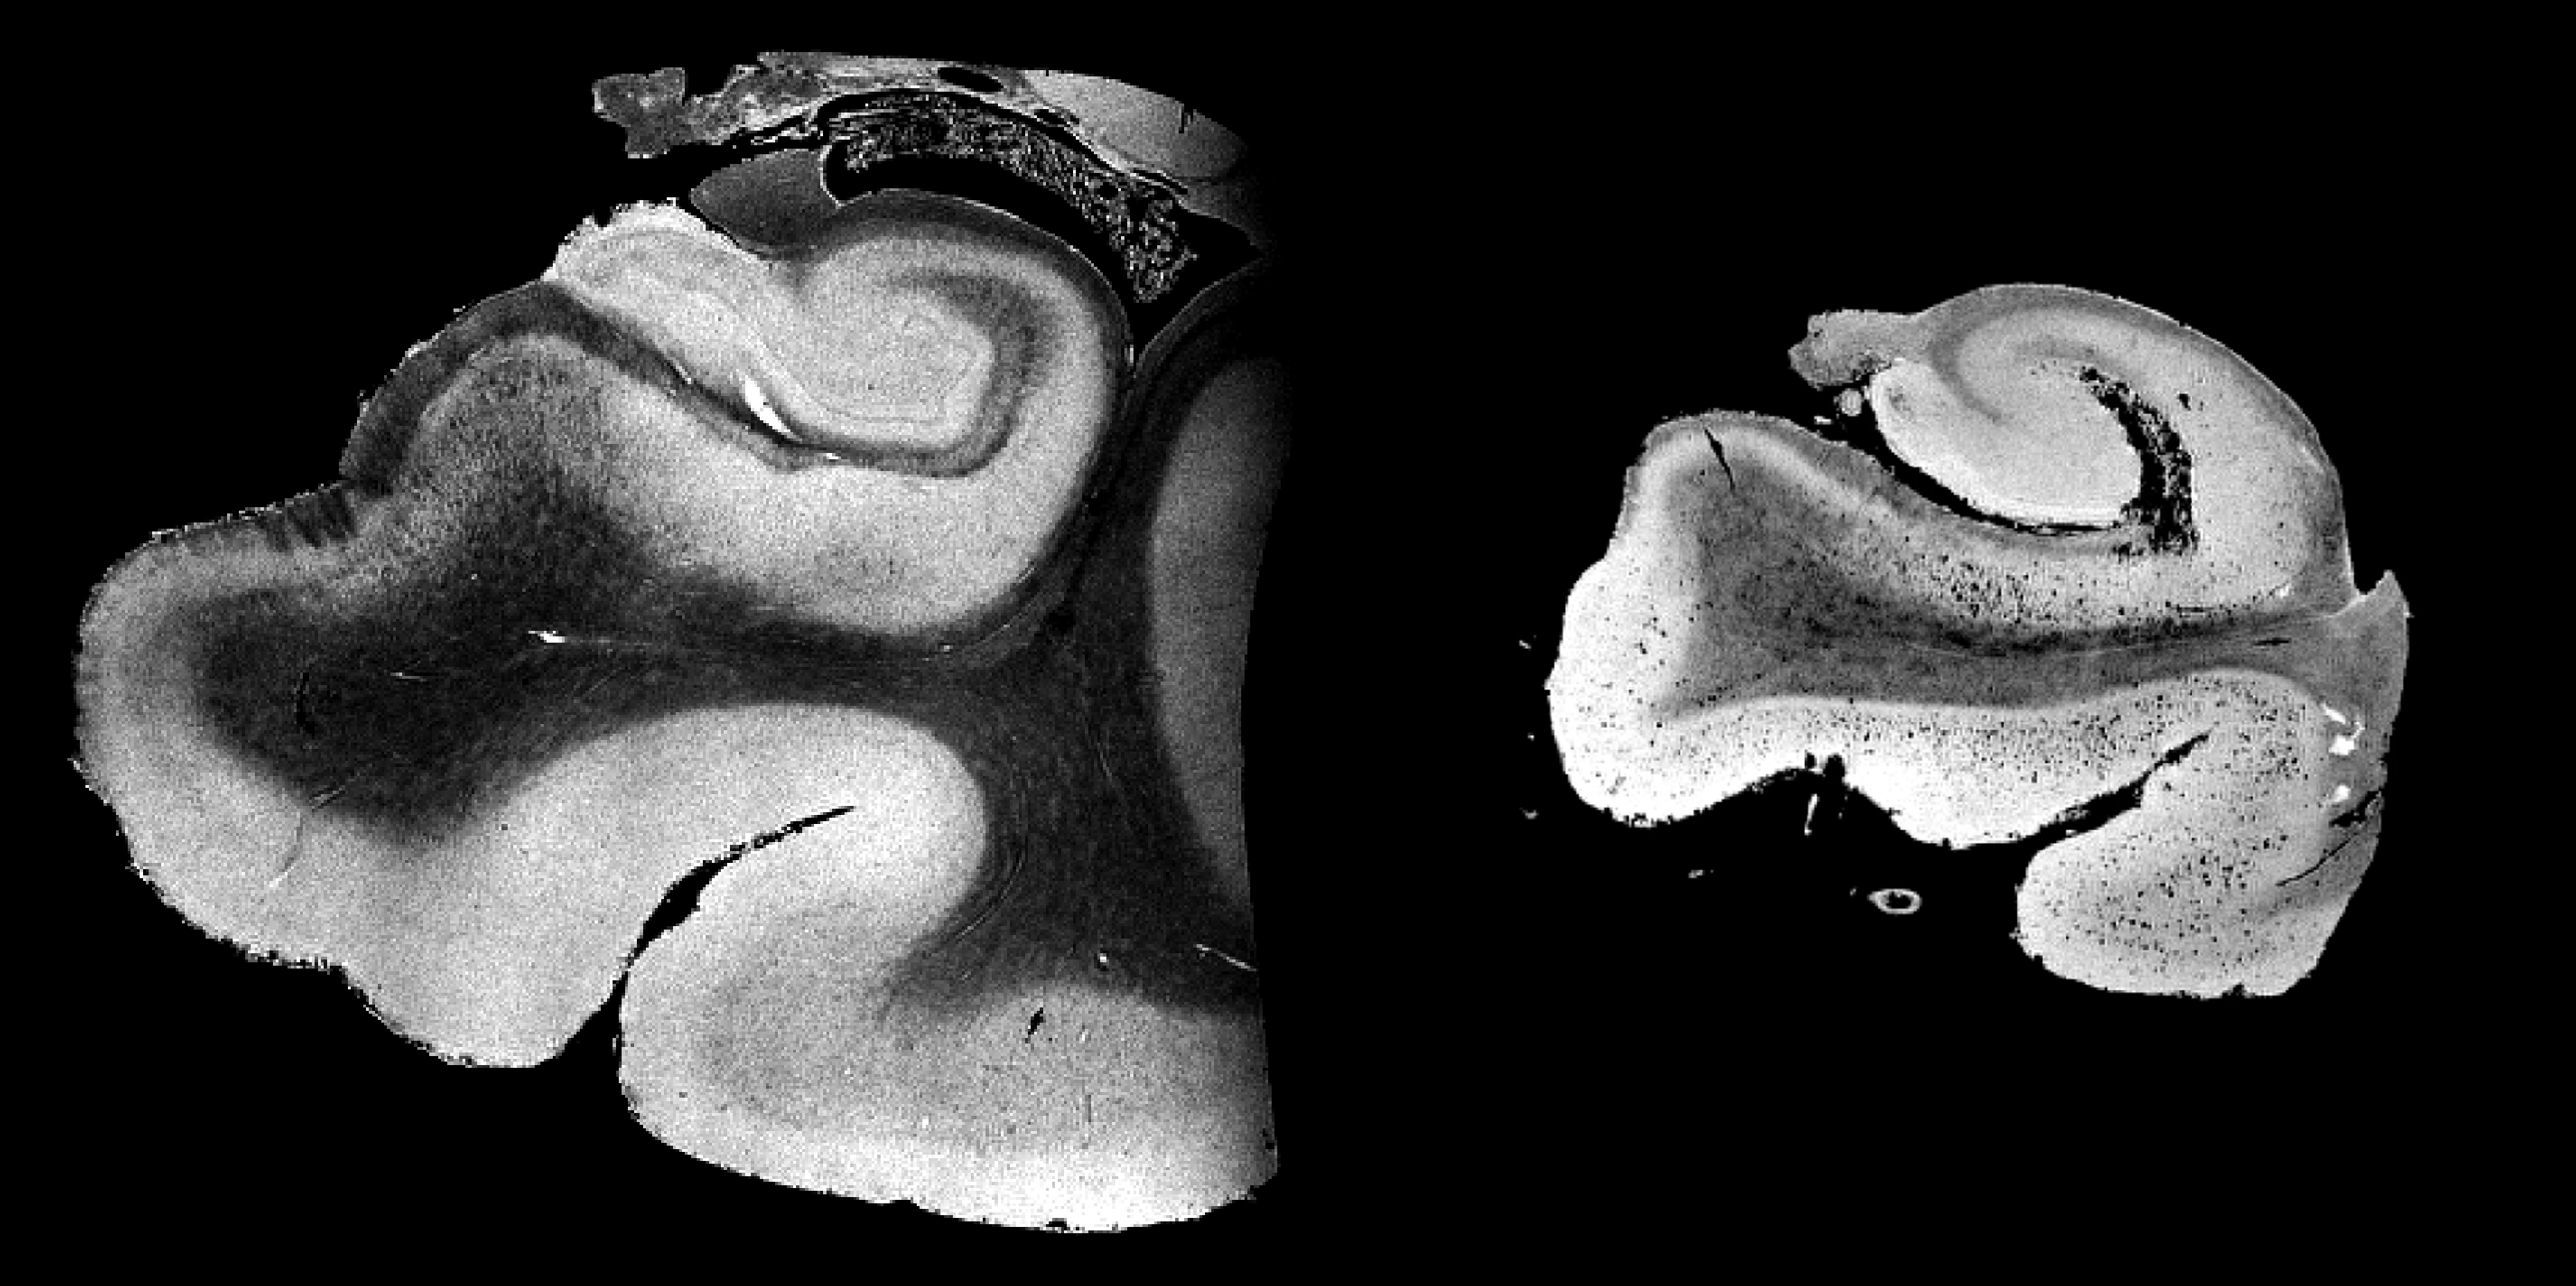
Beyond the apparent global atrophy that can be seen using in-vivo clinical imaging. Left: An image of the Hippocampus of a cognitively normal subject, right: An image of the Hippocampus of a subject, pathologically diagnosed with stage VI Alzheimer’s disease.
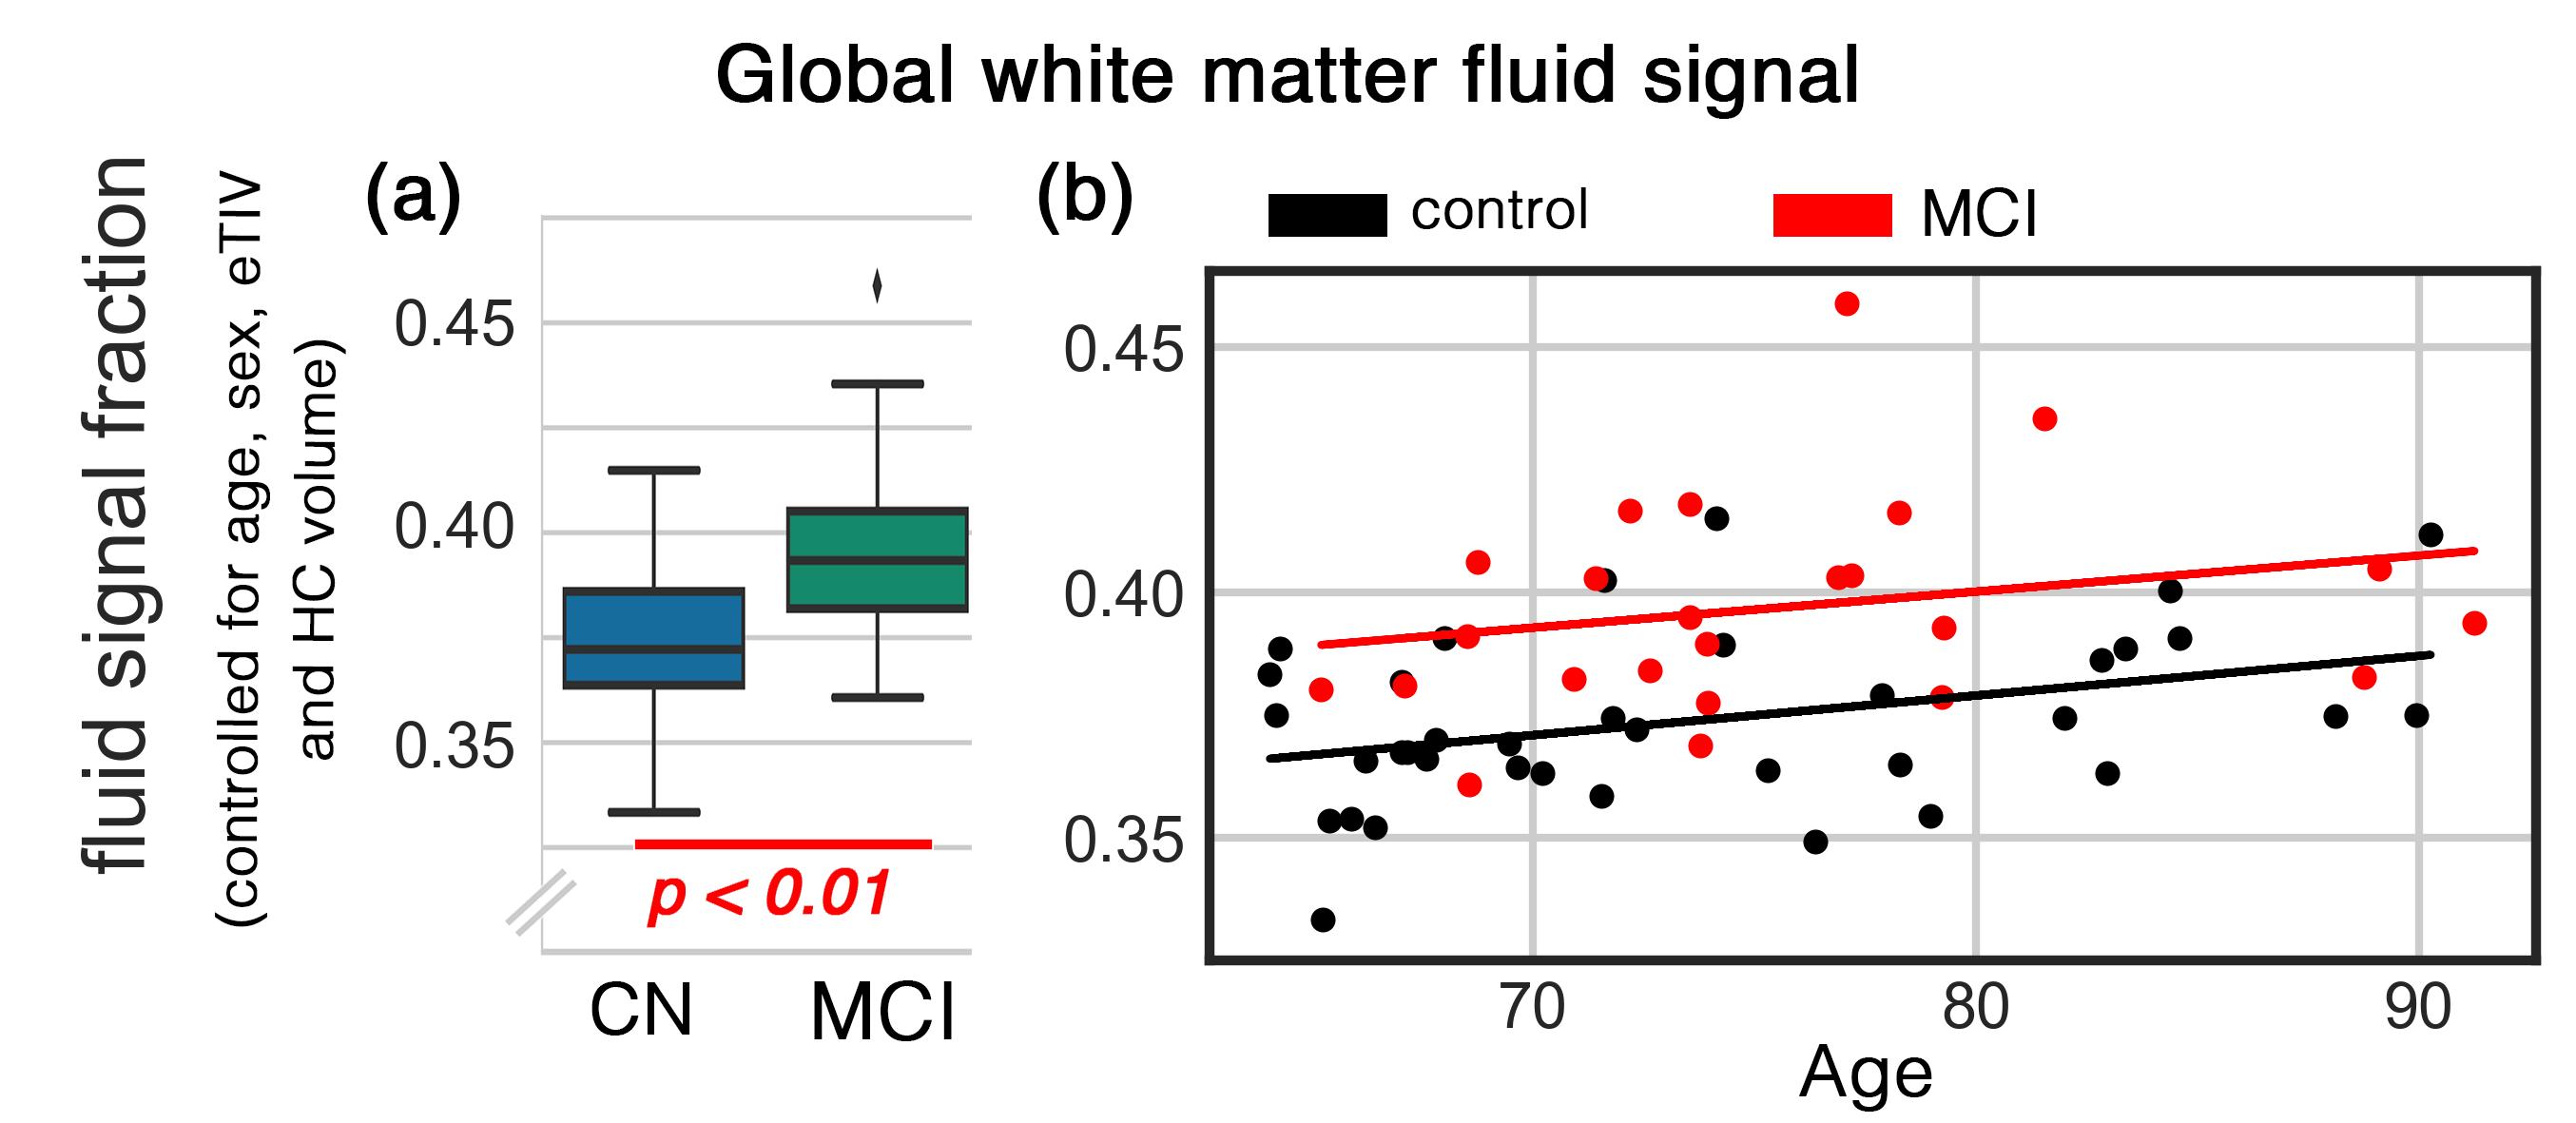
Over the past two decades, MRI studies have reportedly shown that the fluid diffusion in white matter of Alzheimer’s disease (AD) patients is higher. However, the source of this hallmark of AD remained a subject of scientific debate, mainly due to the lack of data and computational tools to investigate these observations in vivo. Using multi-shell diffusion MRI of the ADNI3 project and applied new computational model, we showed that the source of the diffusivity change is the increment of fluid surrounding the white matter tissue. This is a positive step toward understanding the underlying mechanisms of AD pathology and could potentially assist early diagnosis and disease monitoring.
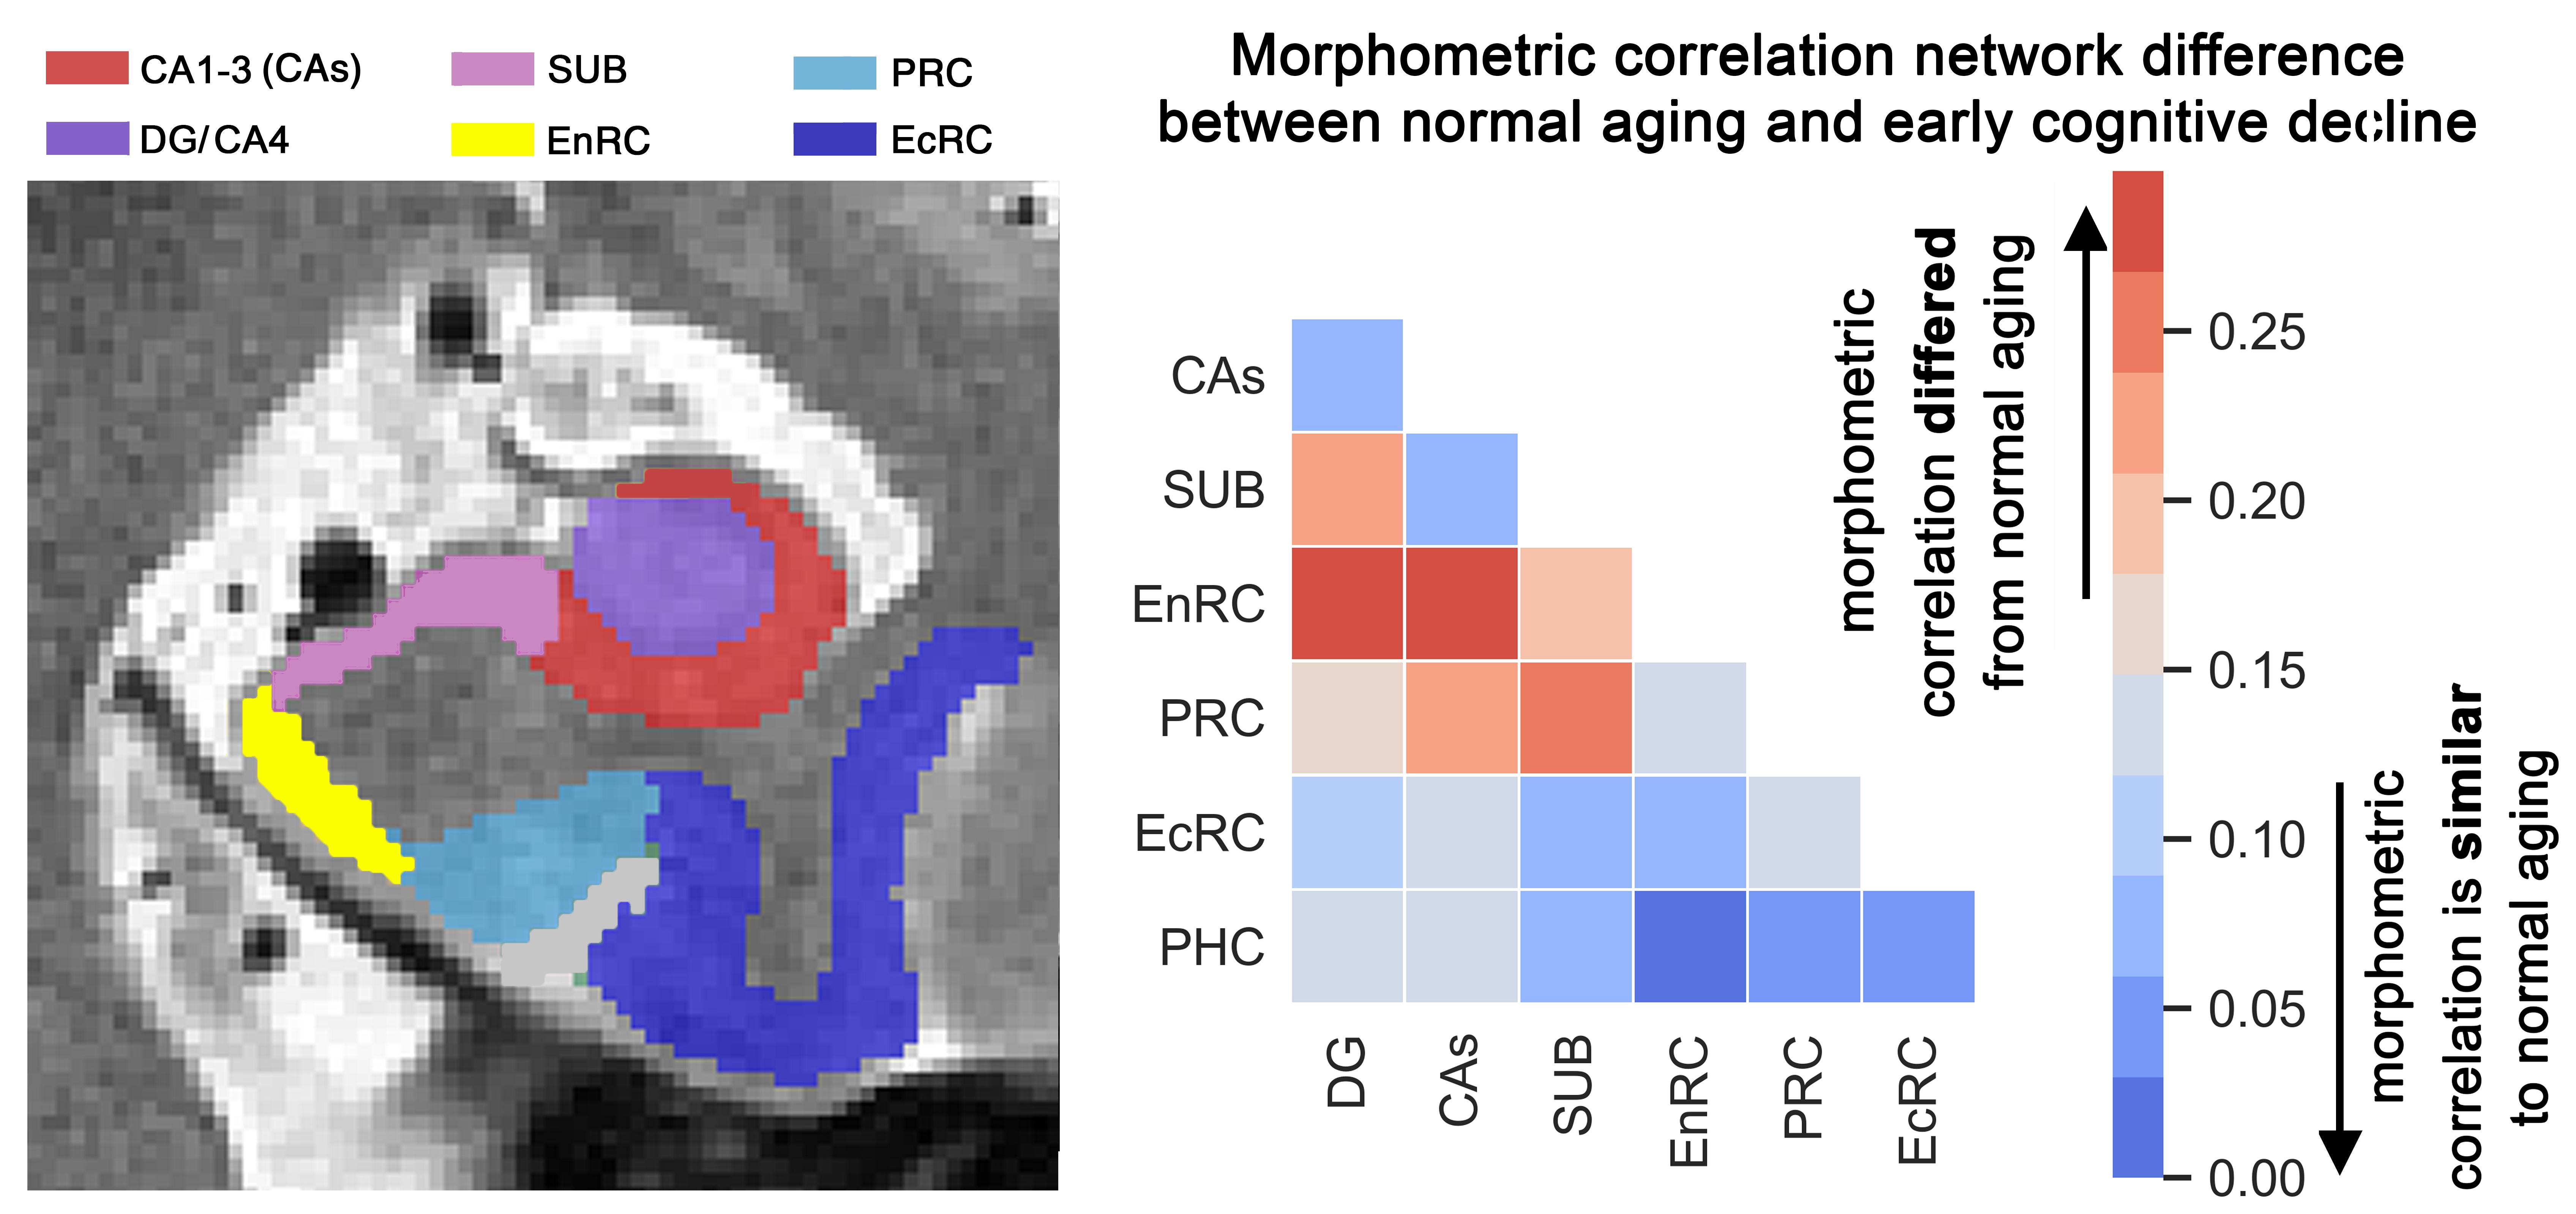
In contrast to diffuse pattern of atrophy in early-onset AD, the late-onset changes are relatively localized in medial temporal lobe (MTL). That said, the age-dependent signature of cortical atrophy within the MTL networks is less understood. Determining age-dependent pattern of atrophy in the MTL would allow for better localization of the degenerations process during the pre-symptomatic stages of the late-onset AD, and potentially early and personalized diagnosis. In this study, we investigated morphometric differences within the medial temporal lobe regions, including hippocampal subfields, in early cognitive decline versus normal aging.
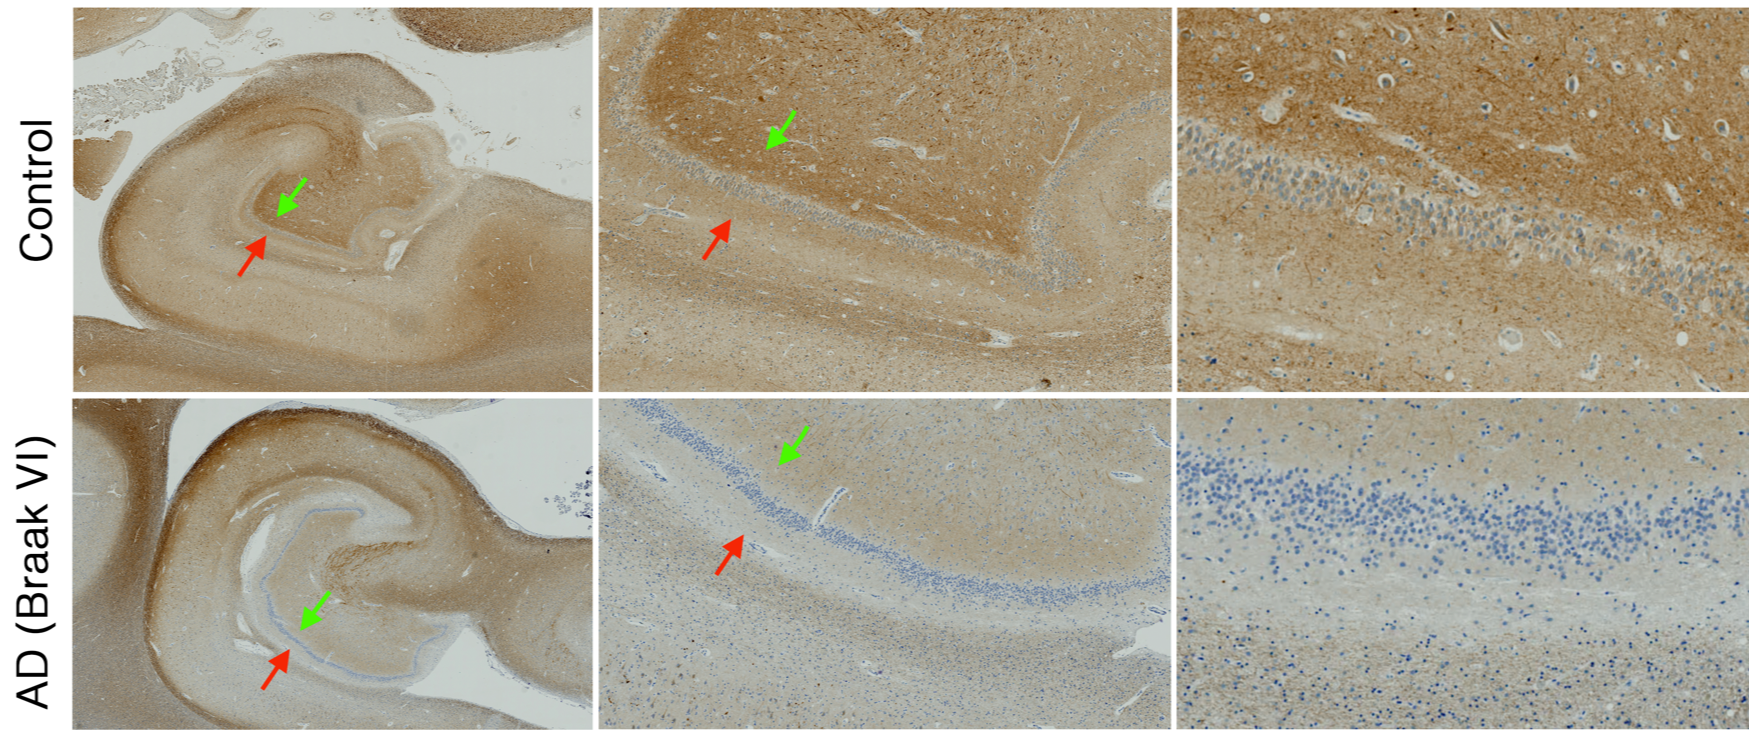
NF-160 images of a control tissue in comparison with an AD case. Note that a darker band in molecular layer (red arrow) are not distinguishable in the AD case, suggesting dendritic loss in the molecular layer. Polymorphic layer of the dentate gyrus suggest axonal loss in the AD case (green arrows).
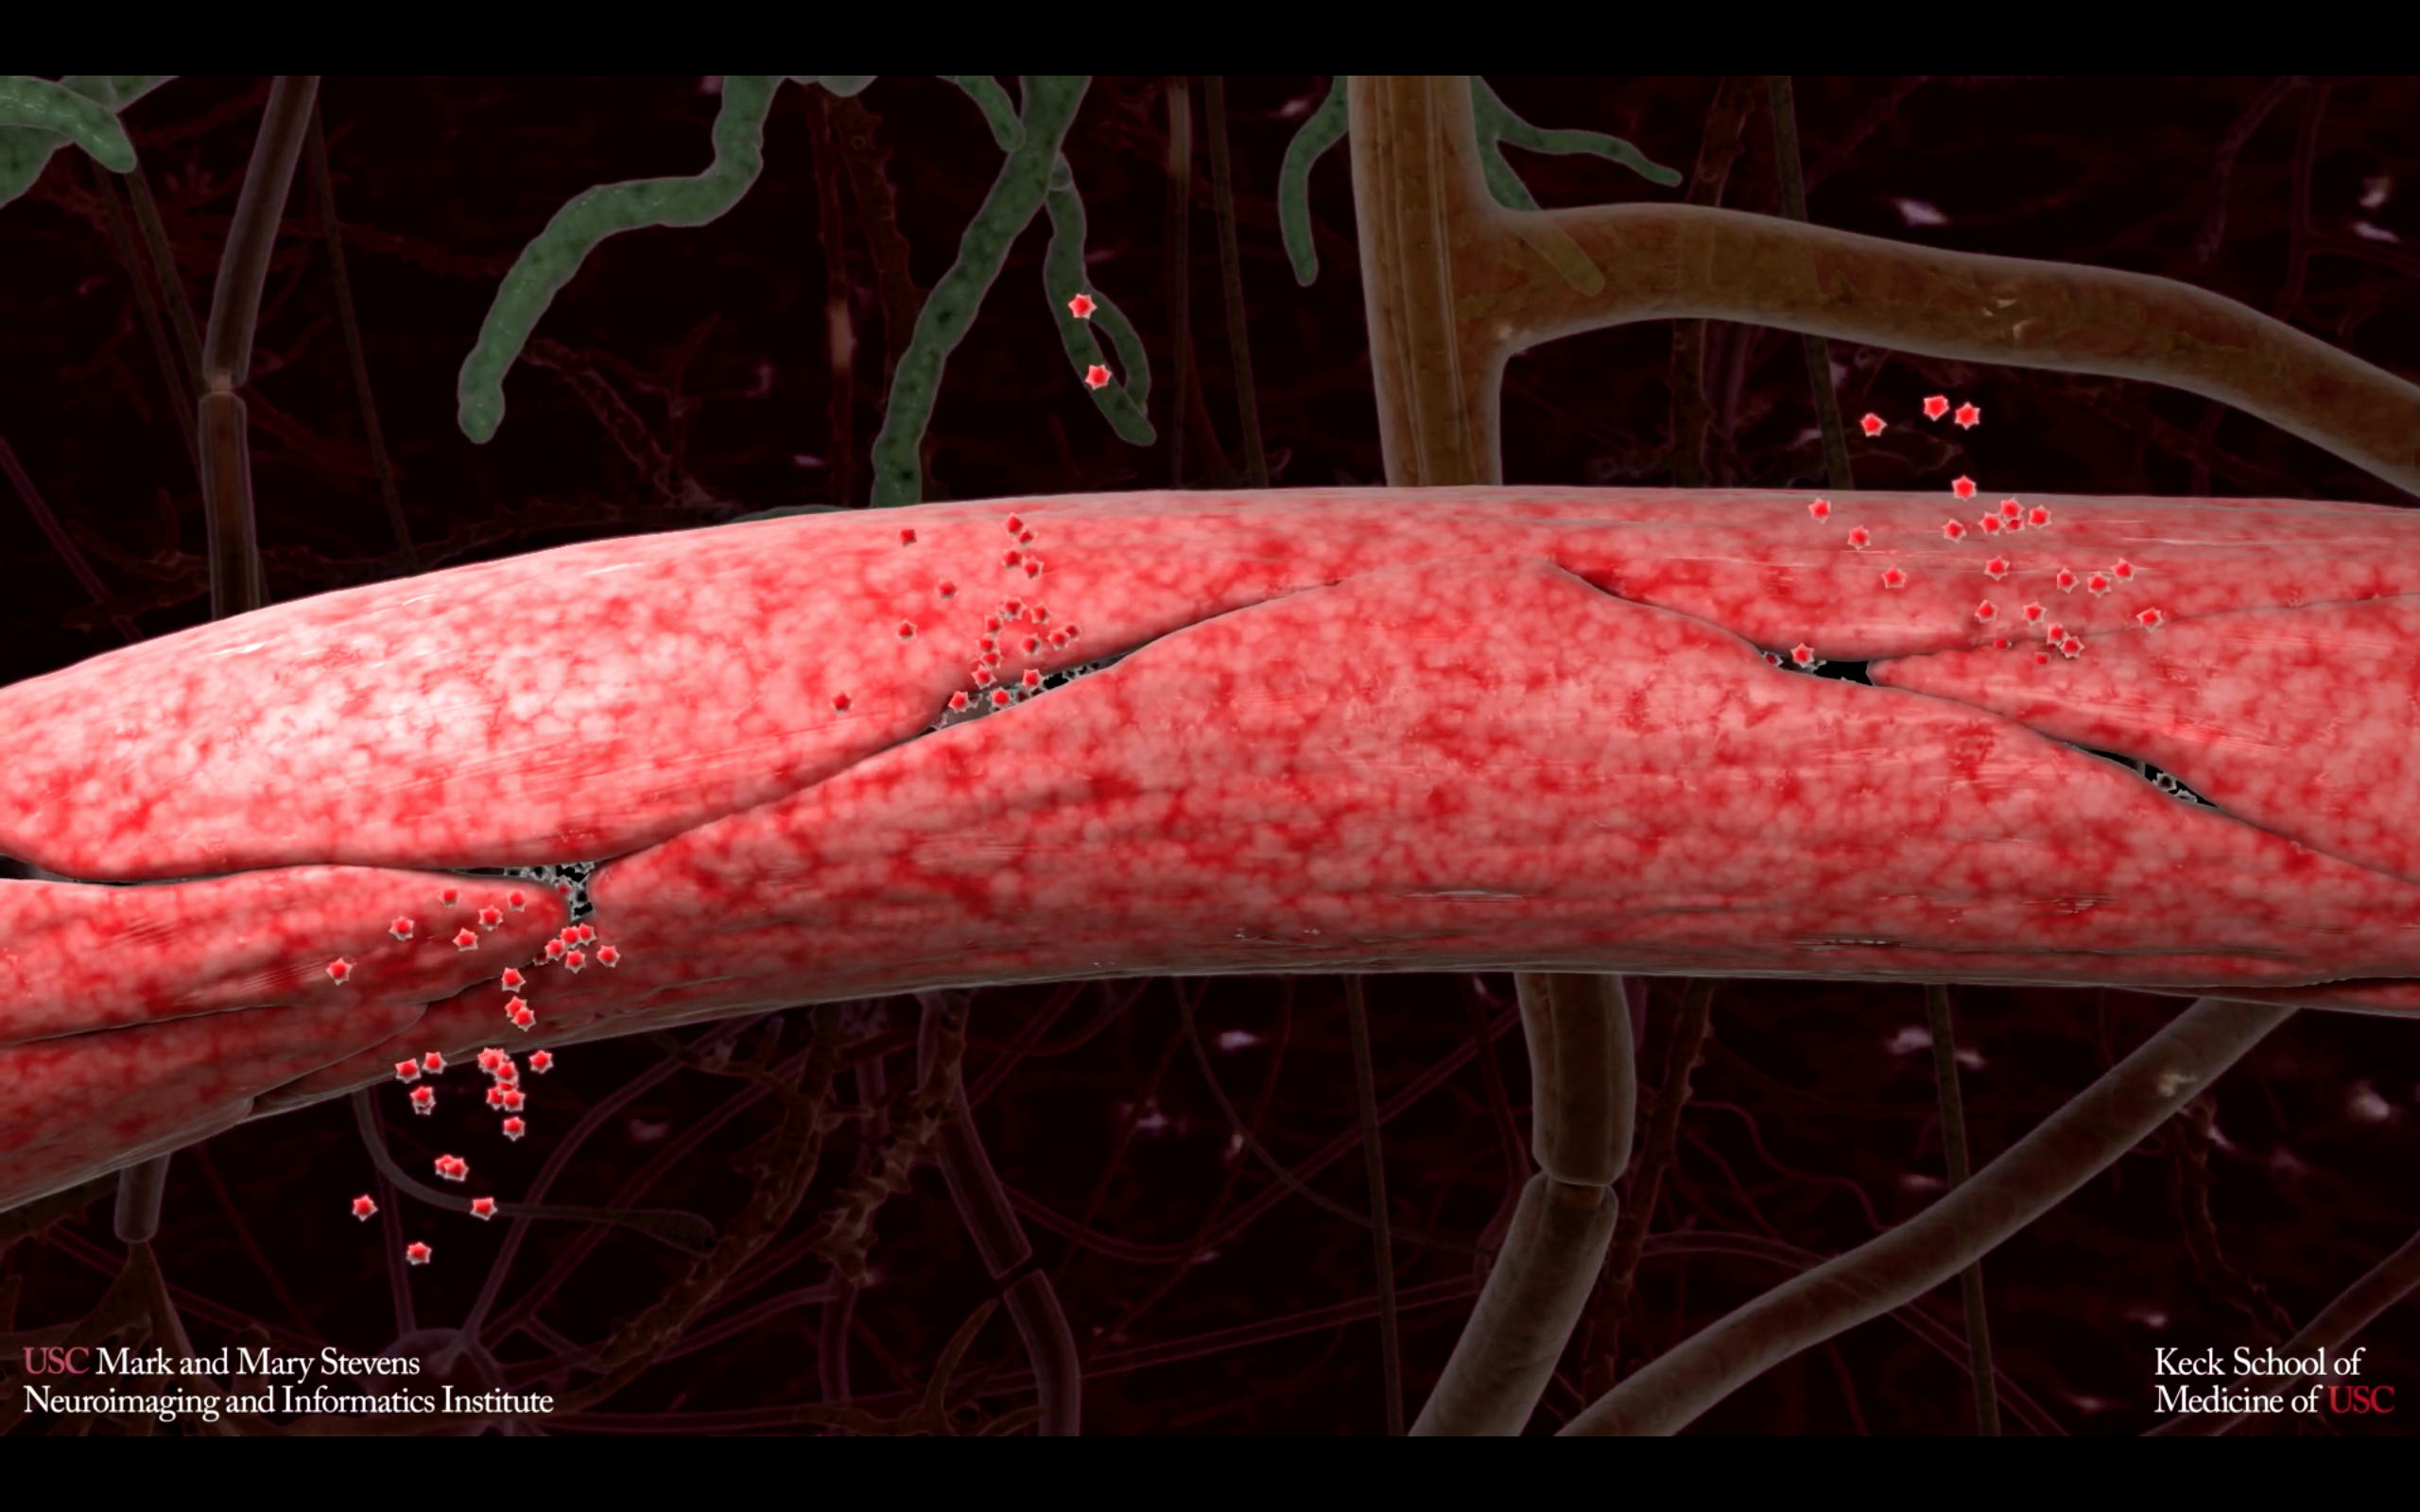
Vascular contributions to Alzheimer’s disease (AD) and dementia are increasingly recognized. here we show that individuals with early cognitive dysfunction develop brain capillary damage and blood brain barrier (BBB) breakdown in the hippocampus irrespective of Alzheimer’s amyloid and/or tau biomarker changes, suggesting BBB breakdown is an independent, early biomarker of cognitive impairment in aging adults unrelated to amyloid- and tau.
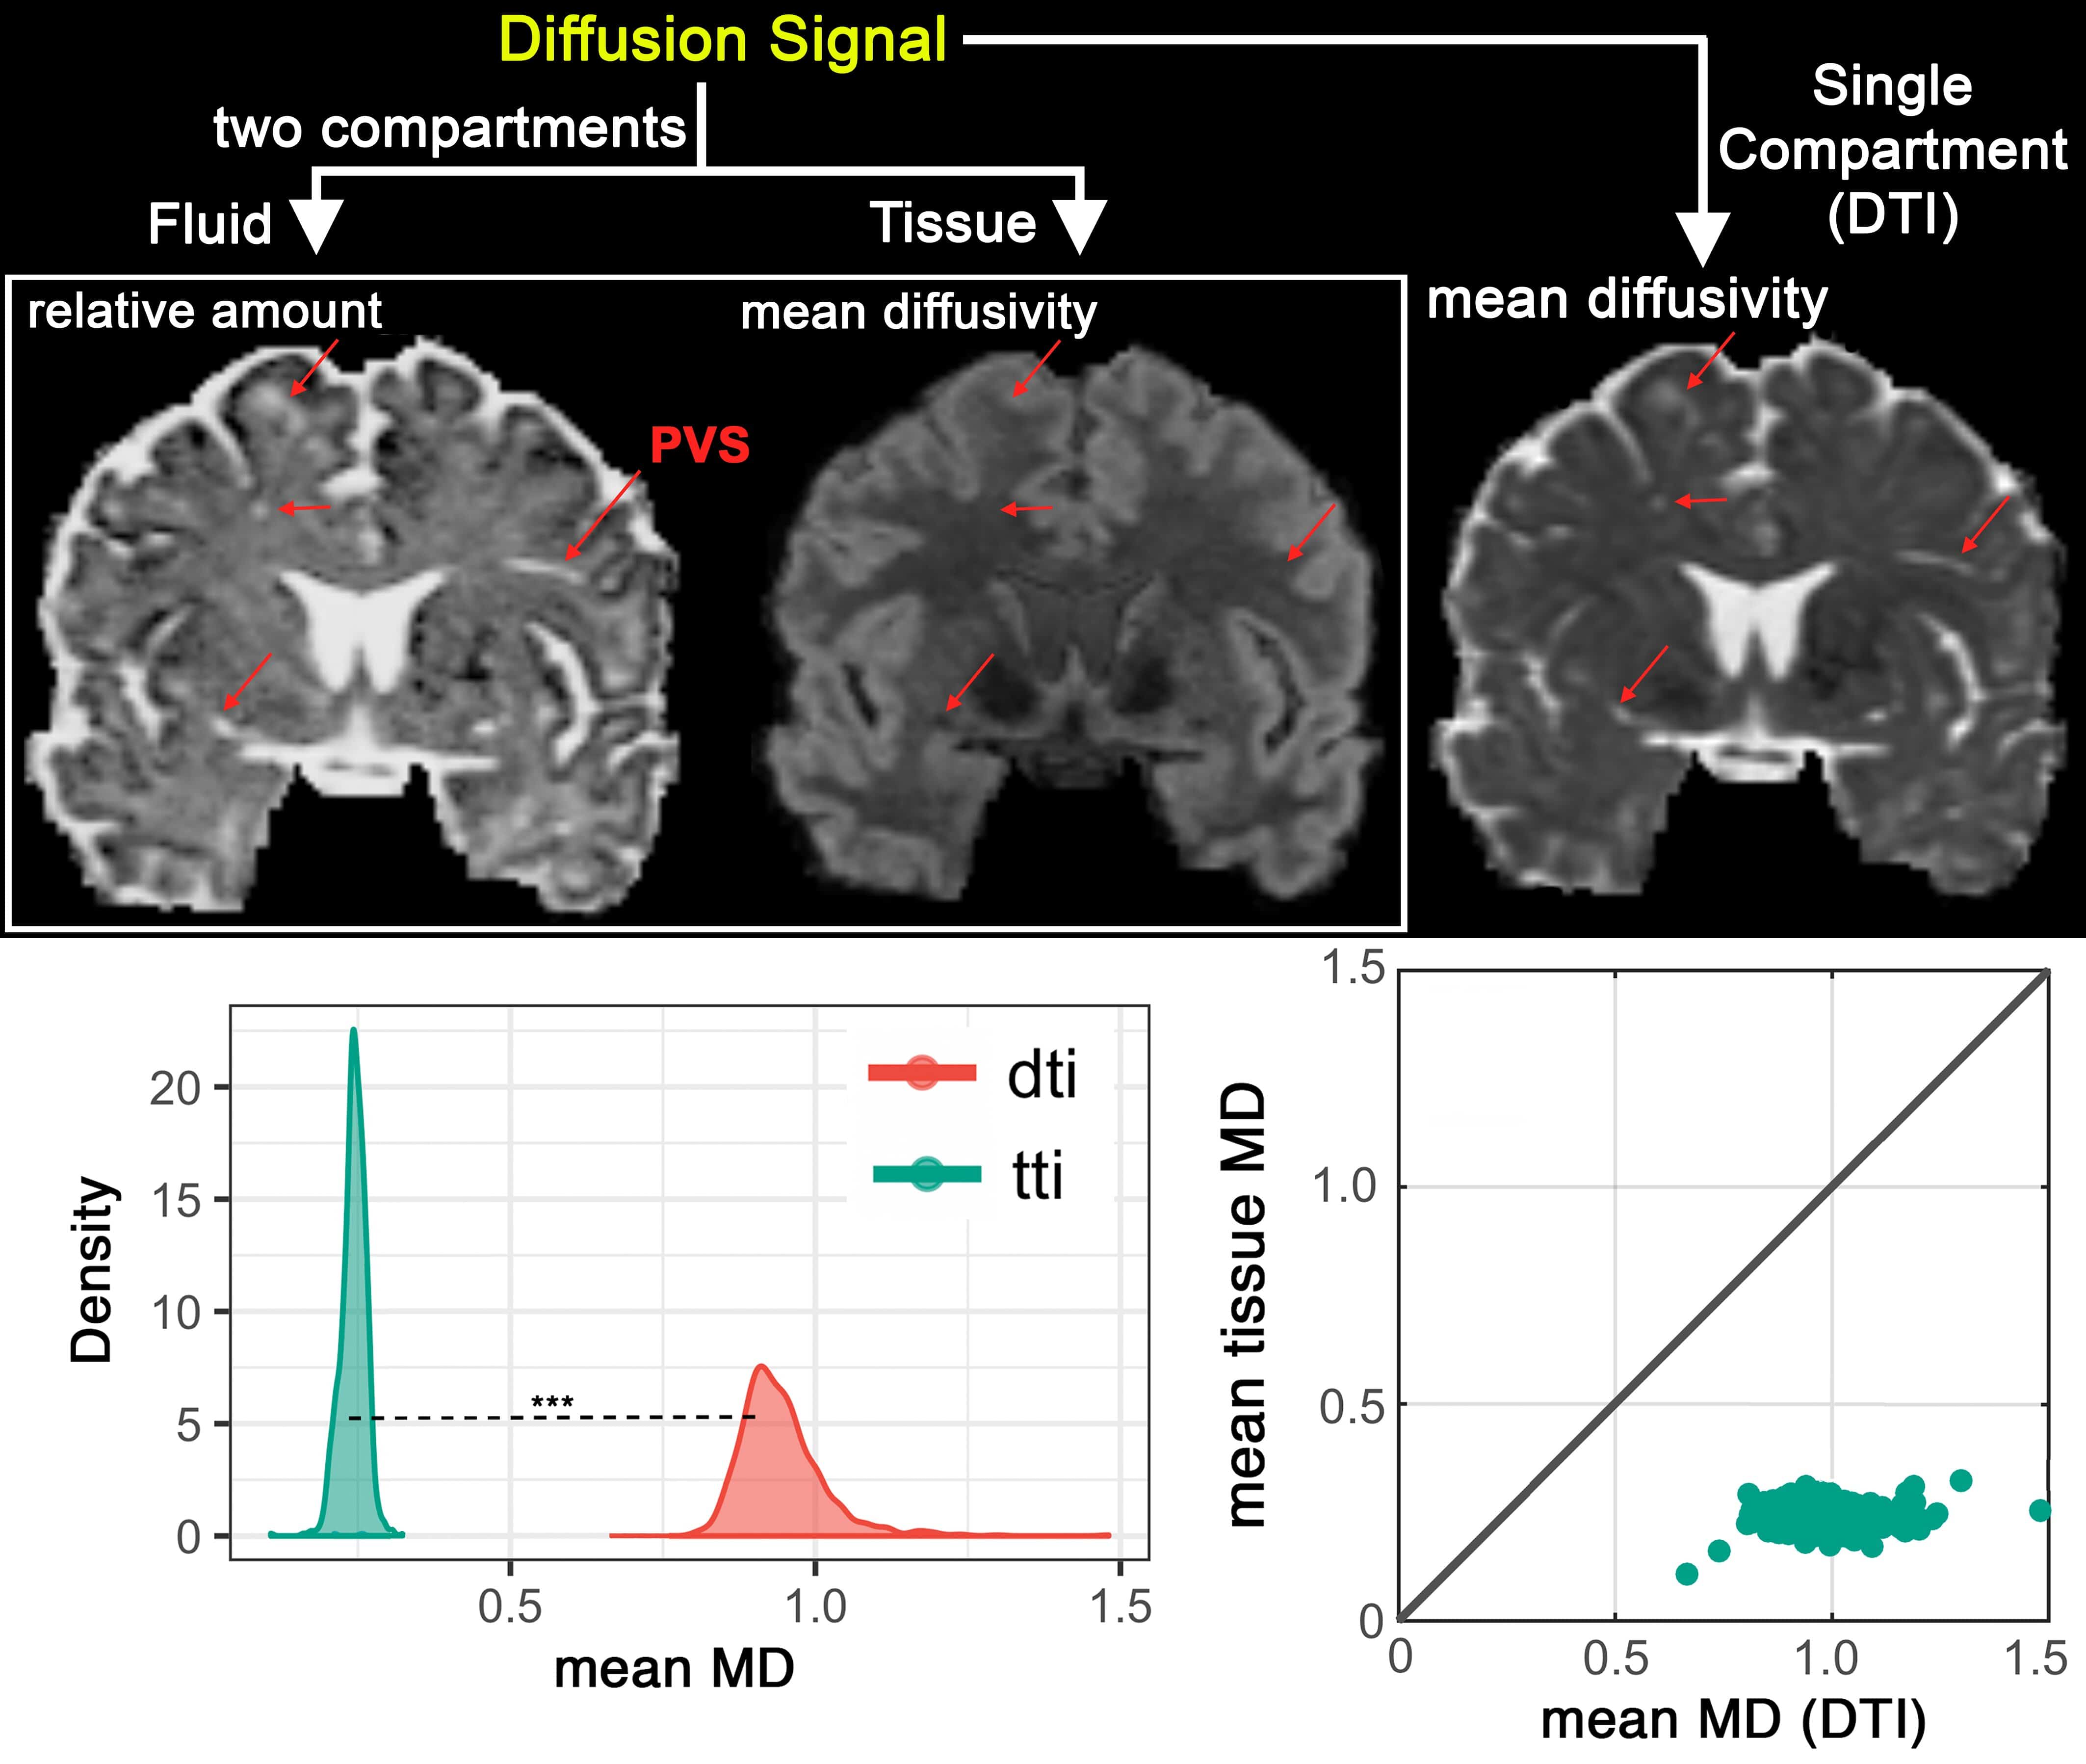
Bi-tensor model separates fluid and tissue signal, which allows mapping of the fluid content (left) and tissue diffusion (middle). Such maps allow specific investigation in to the source of an observe diffusion signal change in the tissue. Mean diffusivity of the DTI however is the average of both and non-specific (right). Quantitative investigation of the influence of PVS on diffusion signal, across 861 subjects is illustrated (second row). Note that DTI measure is significantly higher, due to the presence of the PVS.
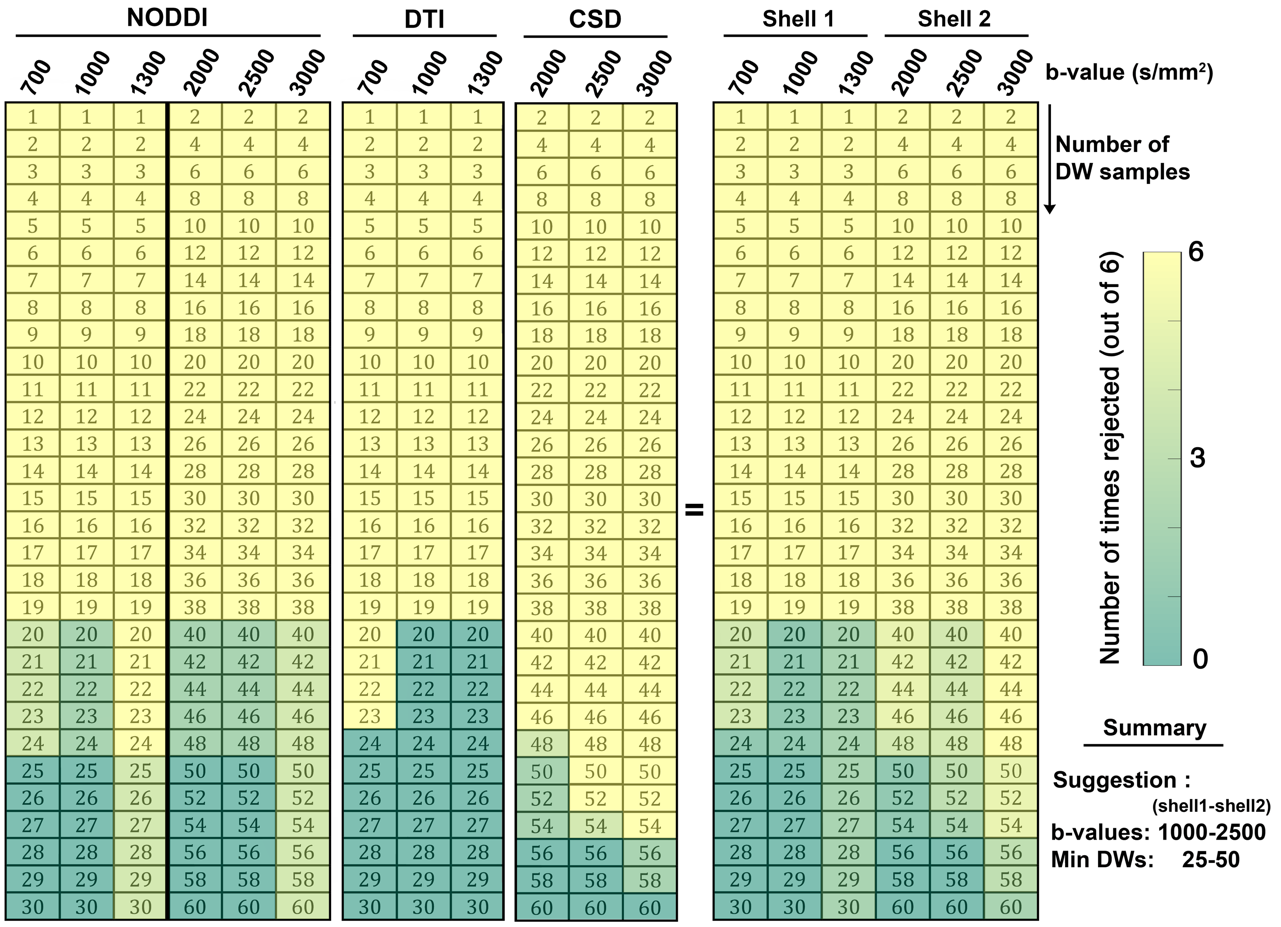
We estimated minimum acquisition requirements that enable diffusion tensor imaging, higher angular resolution diffusion-weighted imaging, neurite orientation dispersion and density imaging and white matter tract integrity across whole brain with isotropic resolution of 1.8mm in less than 11 minutes. The primary audience of this article is the typical end user, interested in diffusion-weighted microstructural imaging at 7 Tesla.
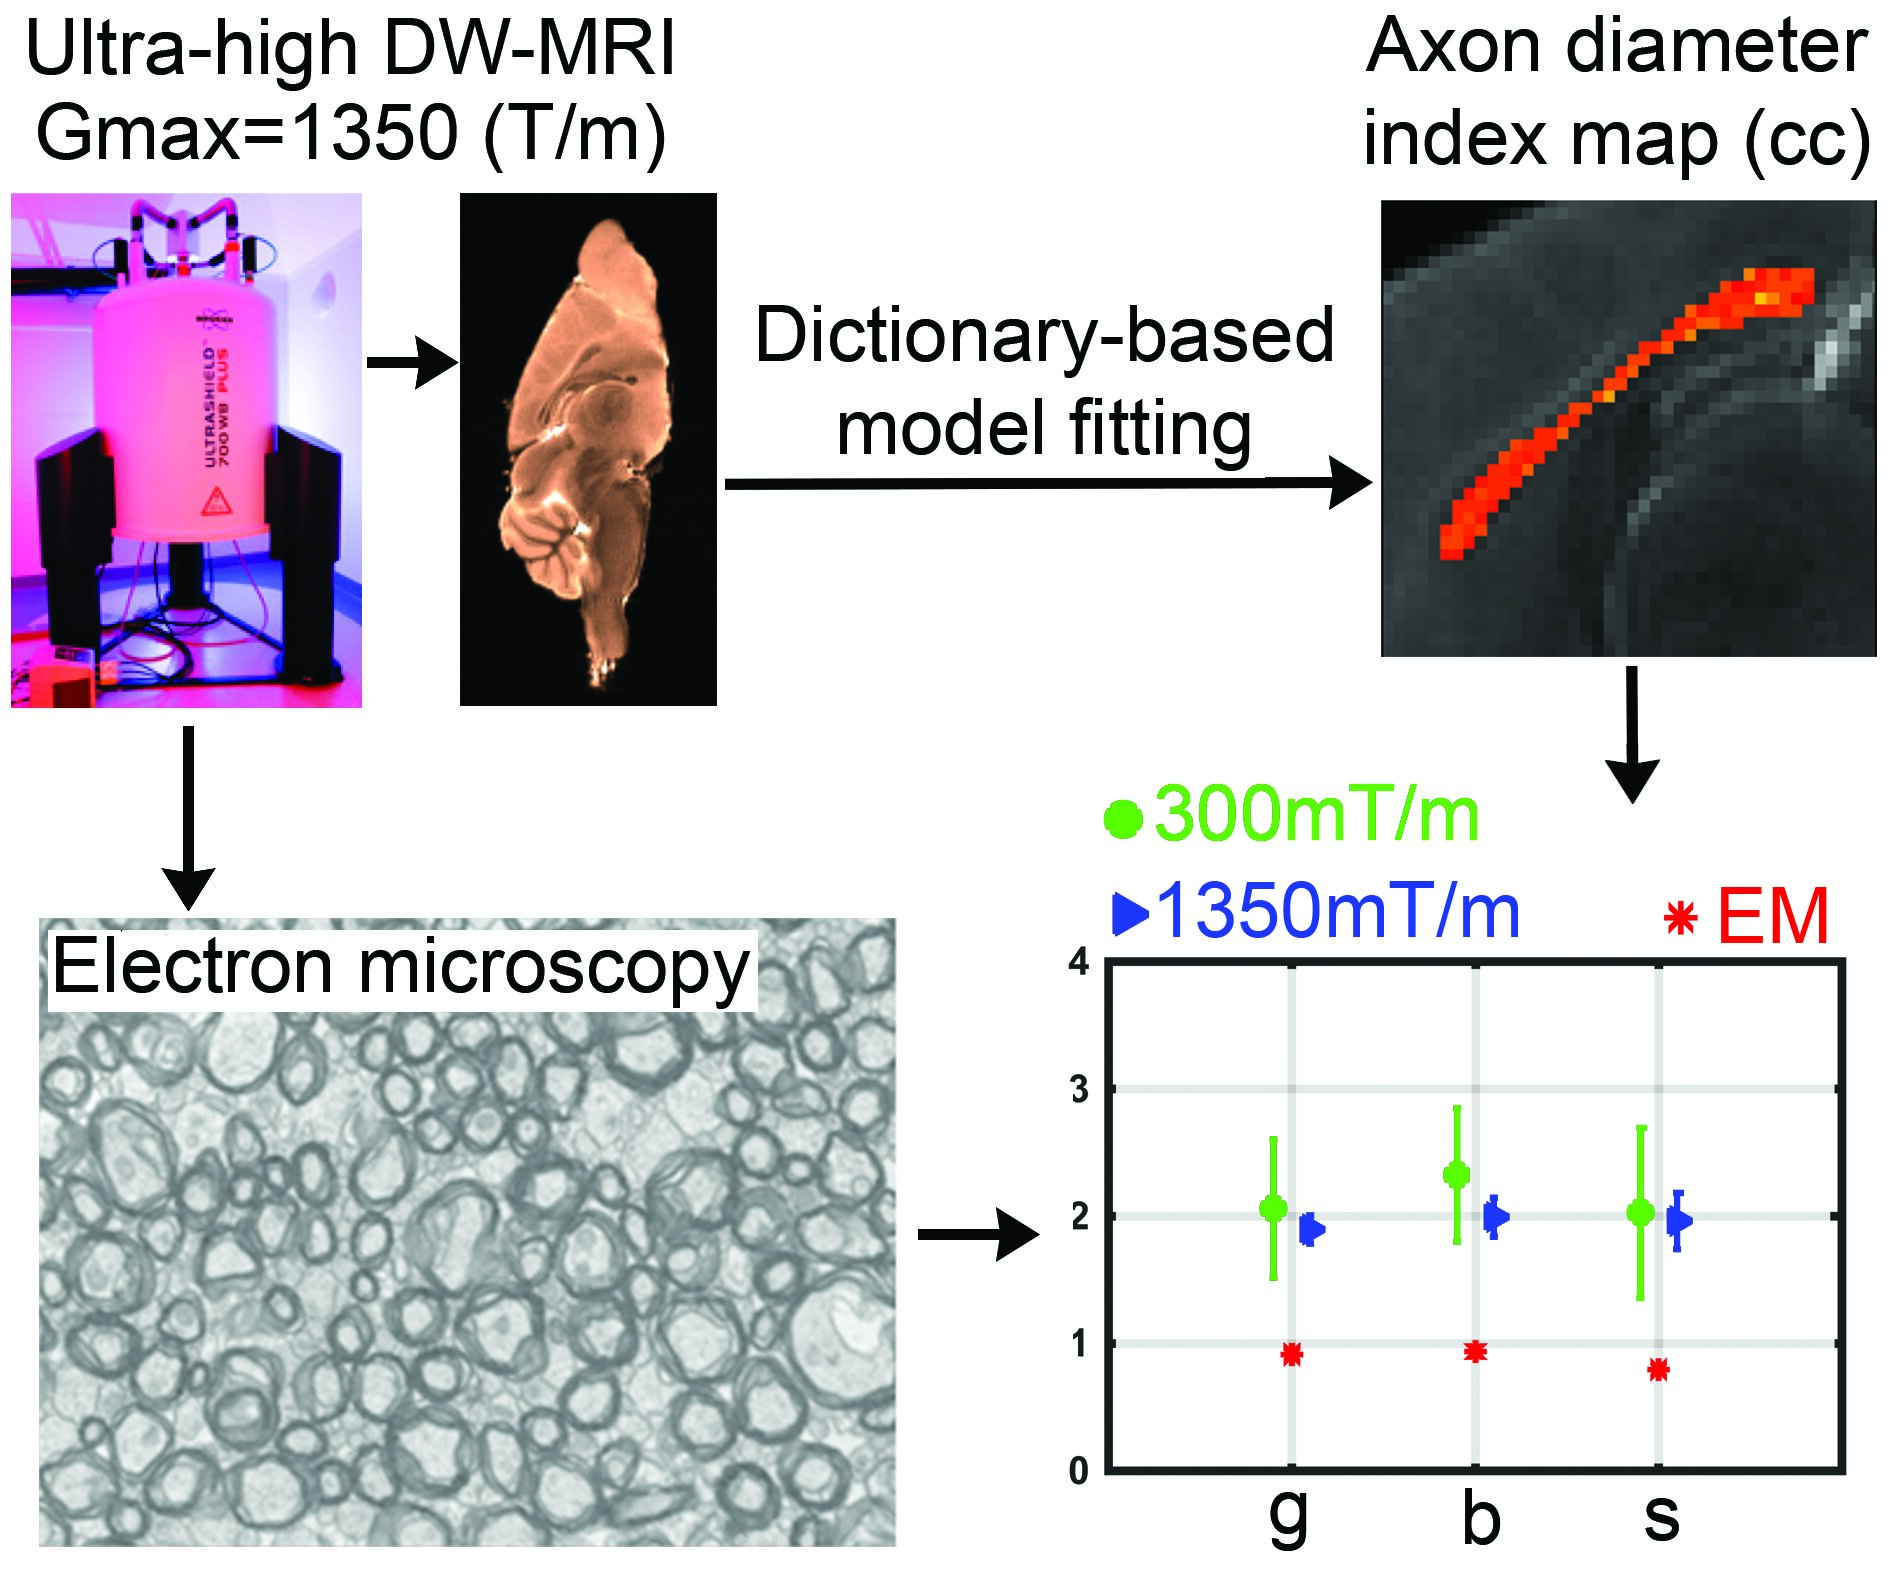
Diffusion-weighted ex vivo images of the mouse brain were acquired using 16.4 Tesla MRI using high (Gmax of 300 mT/m) and ultra-high (Gmax of 1,350 mT/m) gradient strength acquisitions. The estimated axon diameter indices of the mid-sagittal corpus callosum were validated using electron microscopy. In addition, a dictionary-based fitting routine was employed and evaluated. Axon diameter indices were closer to electron microscopy measures when higher gradient strengths were employed. Despite the improvement, estimated axon diameter indices (a lower bound of ~1.8μm) remained higher than the measurements obtained using electron microscopy (~1.2μm).
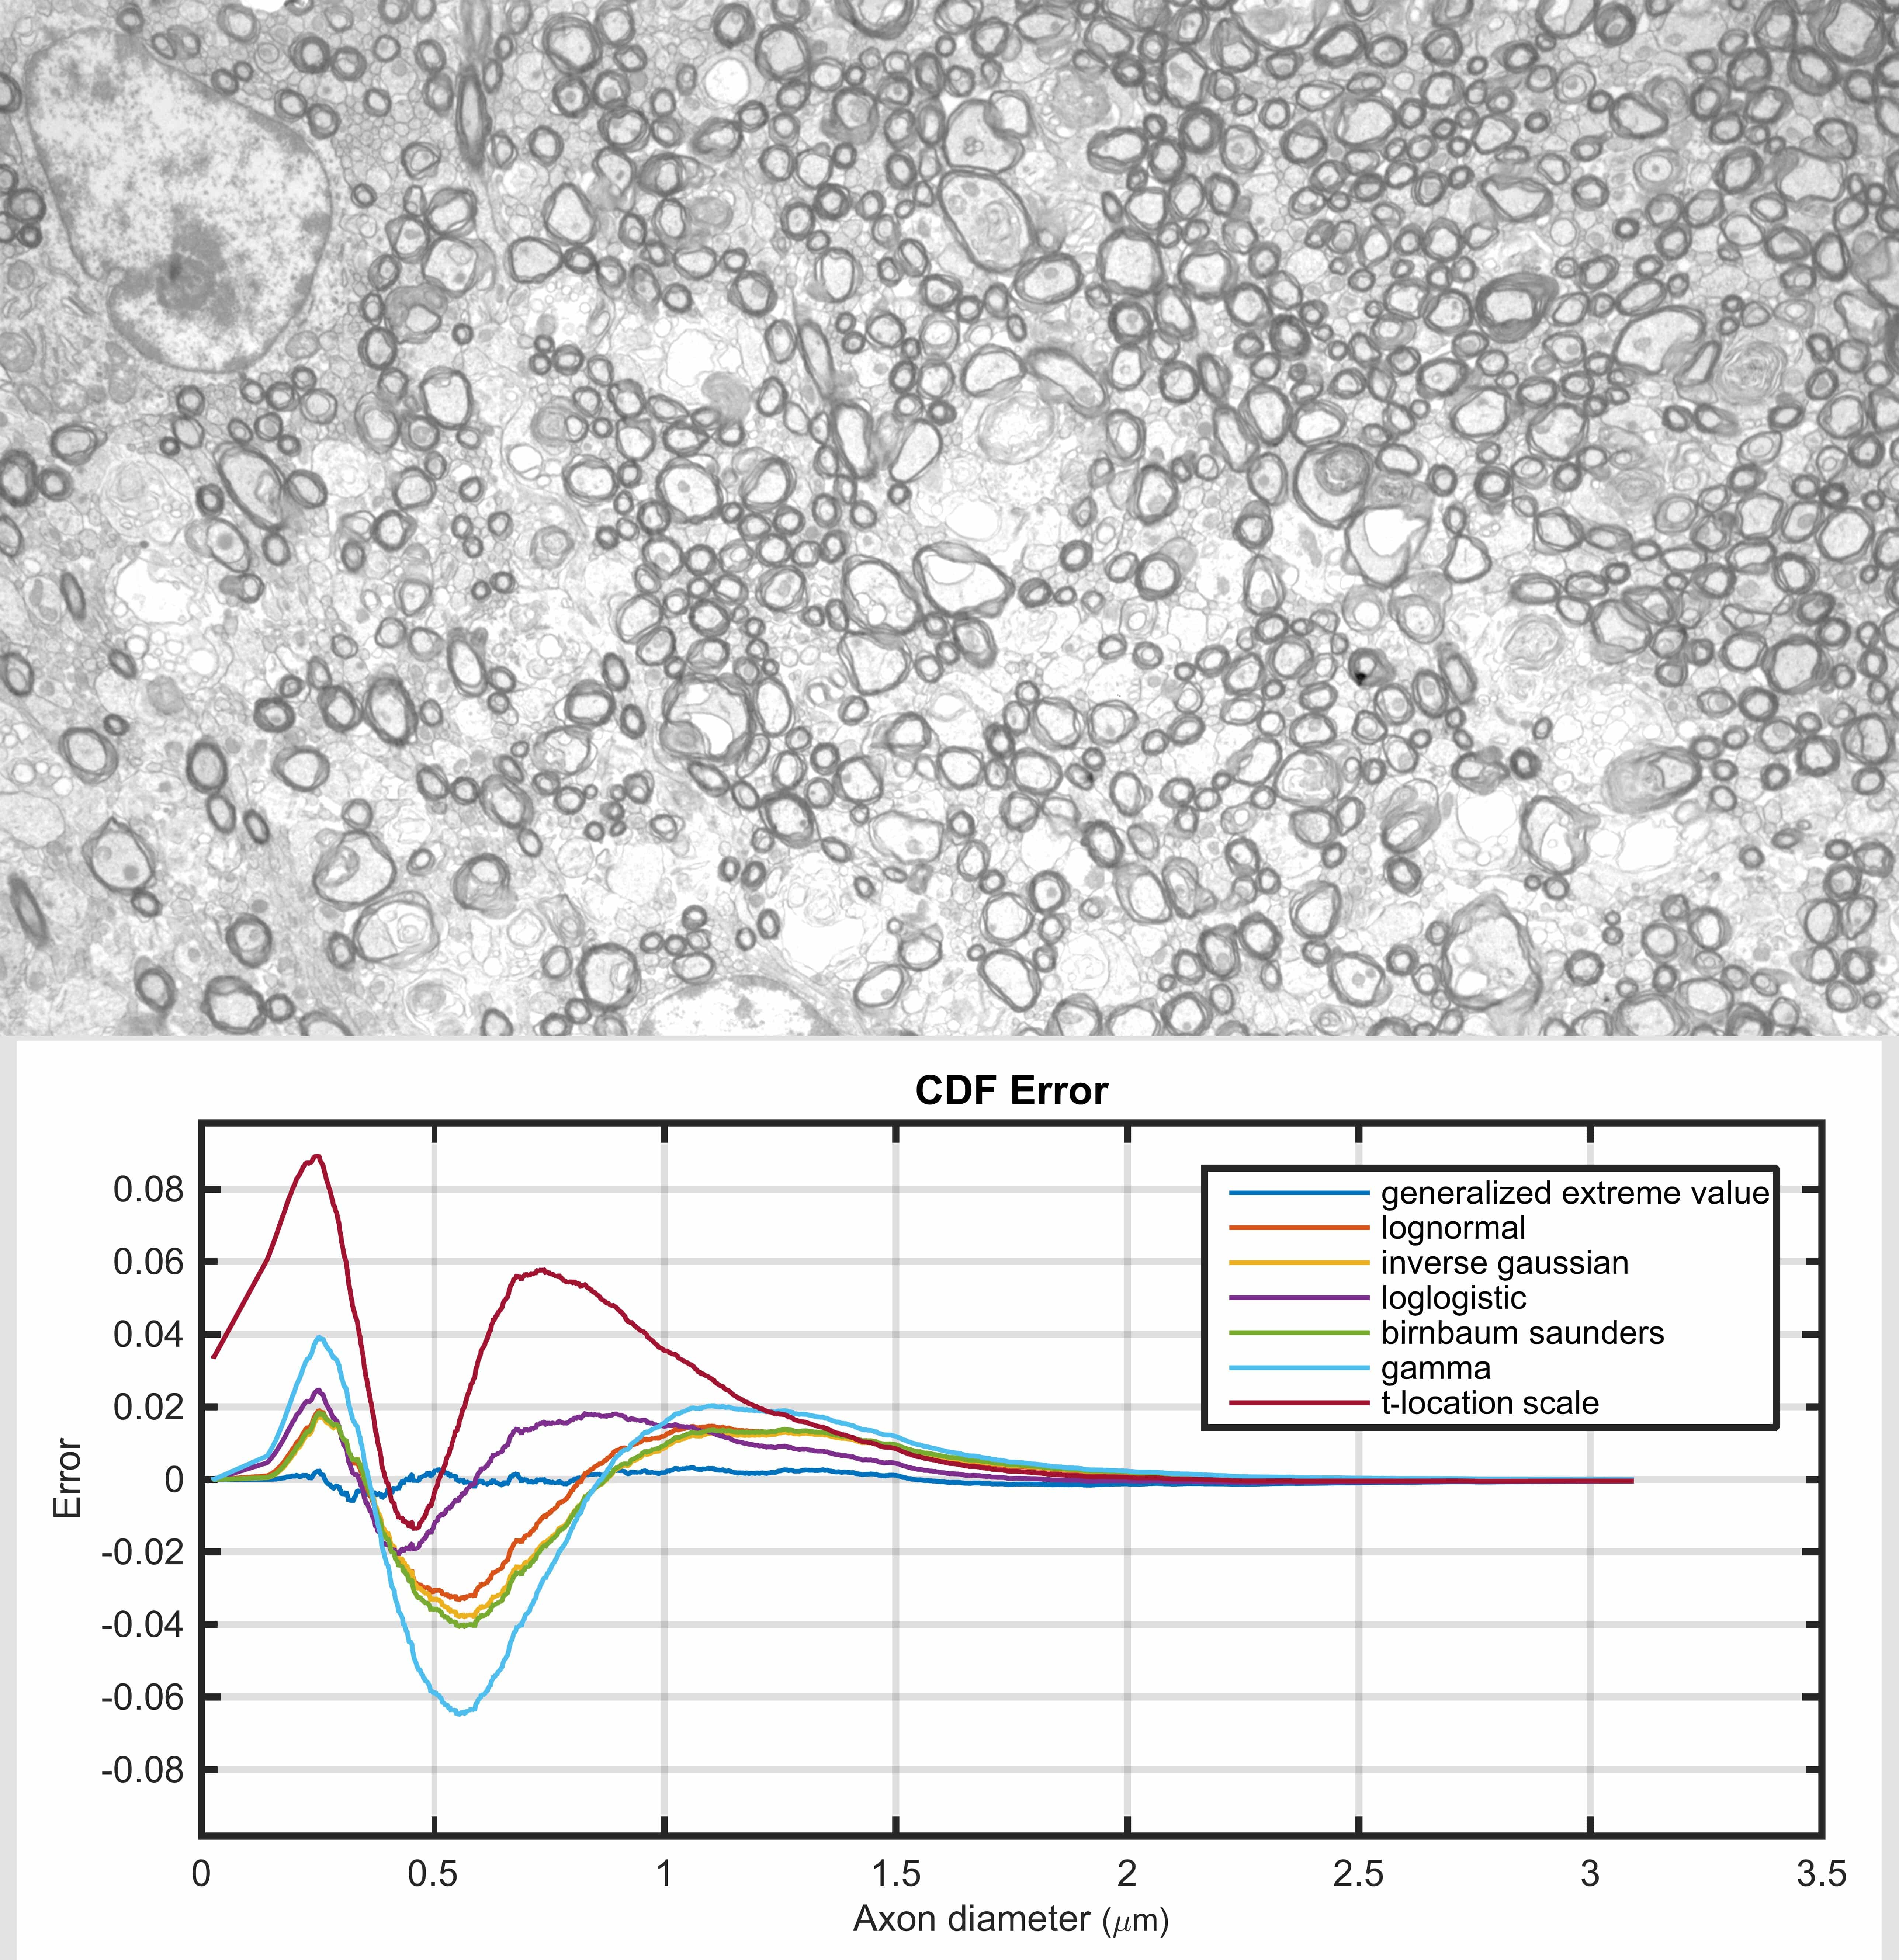
An accurate distribution function is beneficial, either to describe axon diameters that are obtained from a direct measurement technique (e.g., microscopy), or to infer them indirectly (e.g., using diffusion-weighted MRI). The gamma distribution is a common choice for this purpose (particularly for the inferential approach) because it resembles the distribution profile of measured axon diameters which has been consistently shown to be non-negative and right-skewed. In this study we compared a wide range of parametric probability distribution functions against empirical data obtained from electron microscopy images. We observed that the gamma distribution fails to accurately describe the main characteristics of the axon diameter distribution, such as location and scale of the mode and the profile of distribution tails. We also found that the generalized extreme value distribution consistently fitted the measured distribution better than other distribution functions. This suggests that there may be distinct subpopulations of axons in the corpus callosum, each with their own distribution profiles. In addition, we observed that several other distributions outperformed the gamma distribution, yet had the same number of unknown parameters; these were the inverse Gaussian, log normal, log logistic and Birnbaum-Saunders distributions.
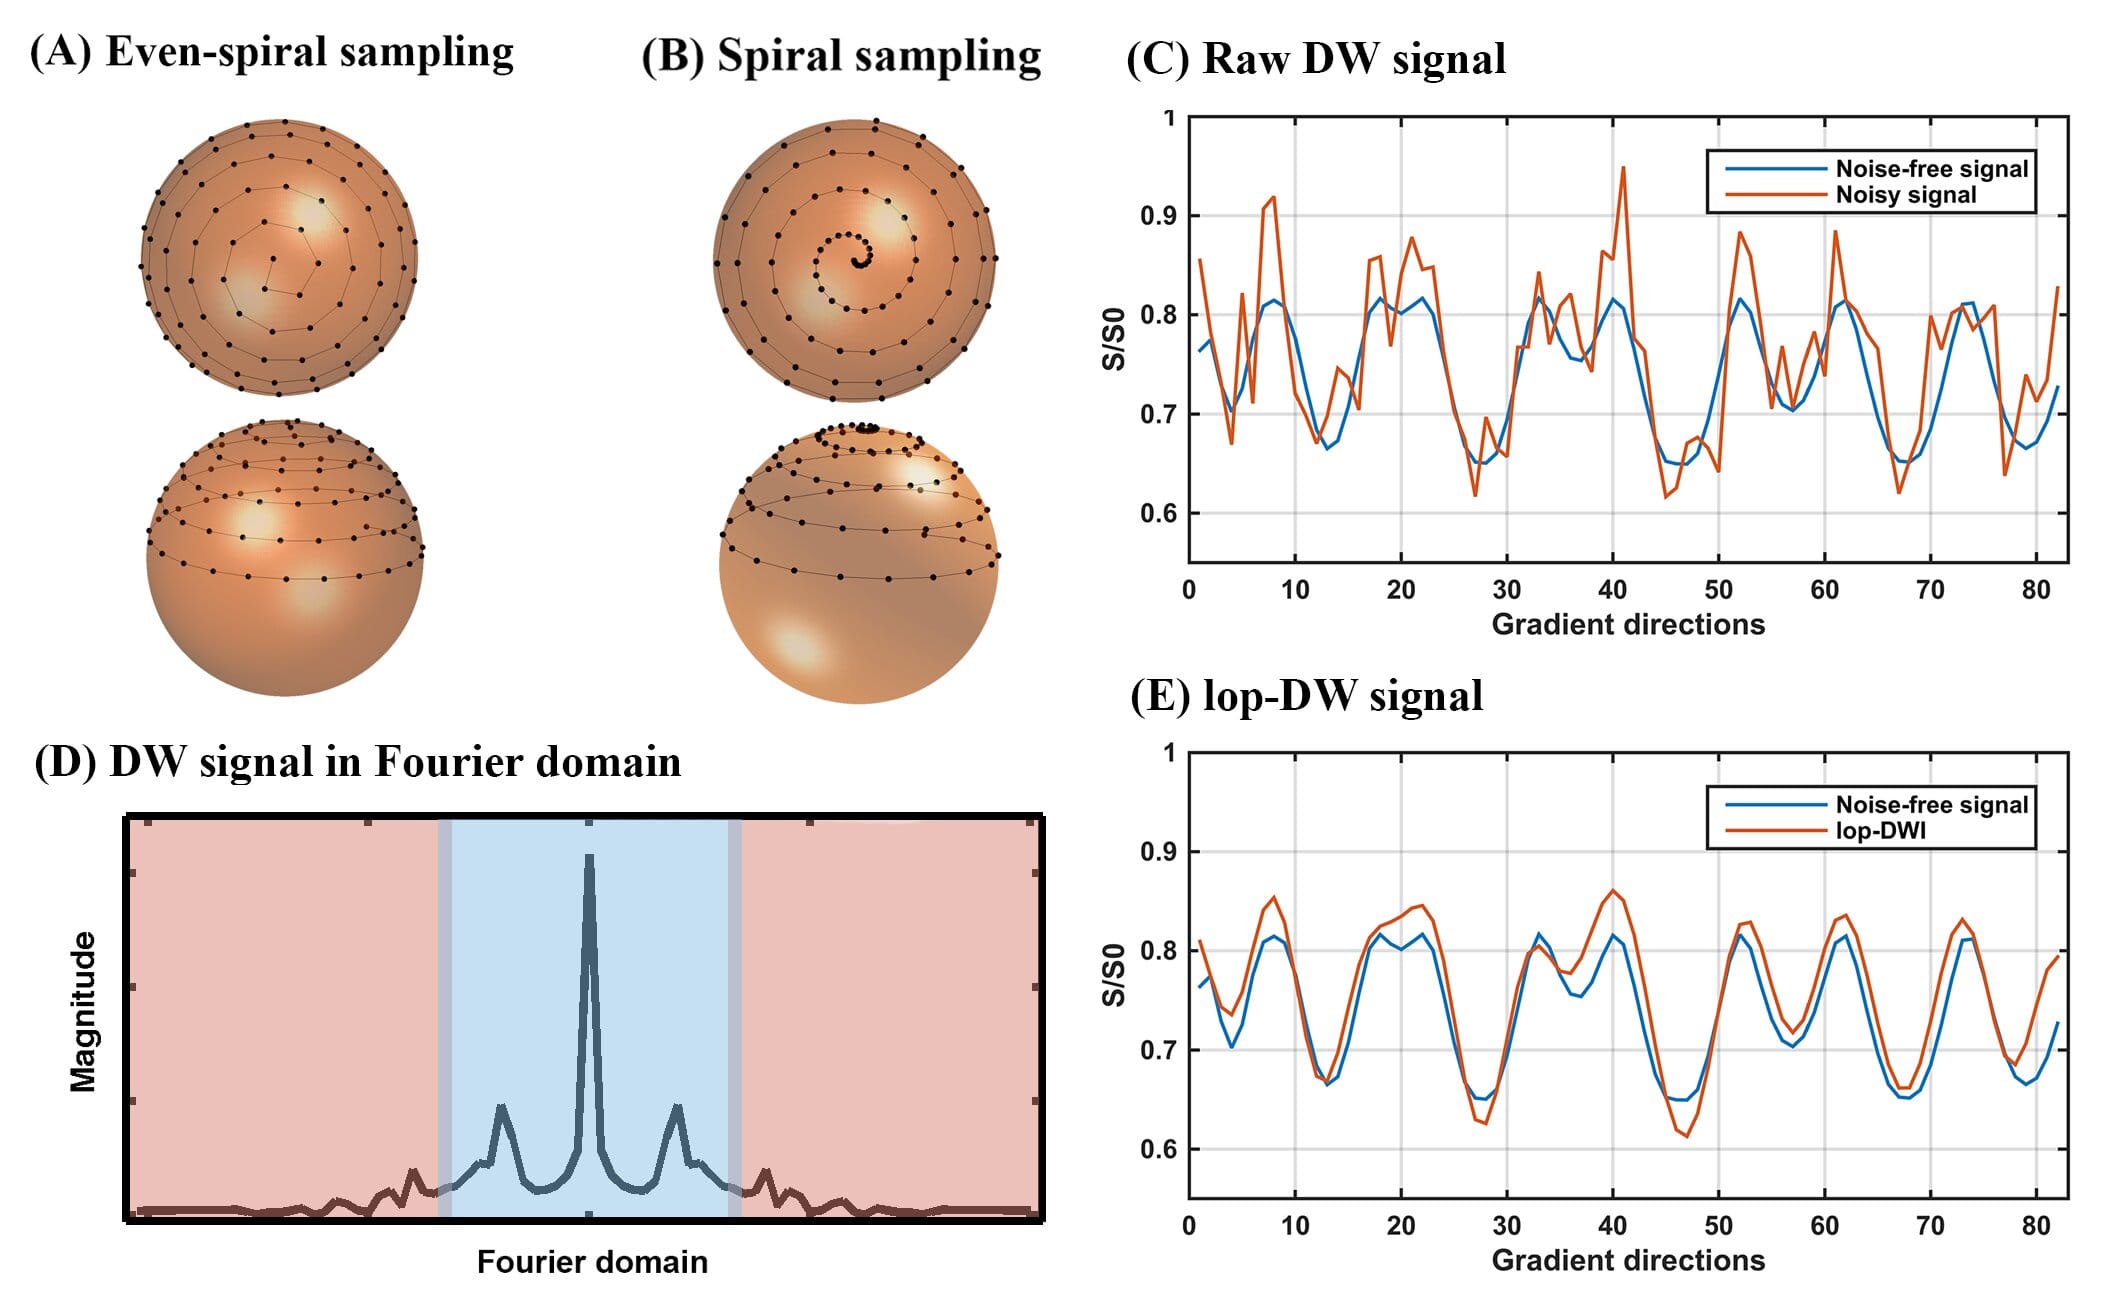
In this work, we describe and evaluate a pre-processing method for diffusion MRI data. Our pre-processing method incorporates prior knowledge about the acquired diffusion-weighted signal, facilitating noise reduction. Periodic spiral sampling of gradient direction encodings results in an acquired signal in each voxel that is pseudo-periodic with characteristics that allow separation of low-frequency signal from high frequency noise. The level of improvement in signal-to-noise ratio and in the accuracy of local reconstruction of fiber tracks were significantly improved using our method. This technique would be most useful as a pre-processing step when obtaining human brain connectome.
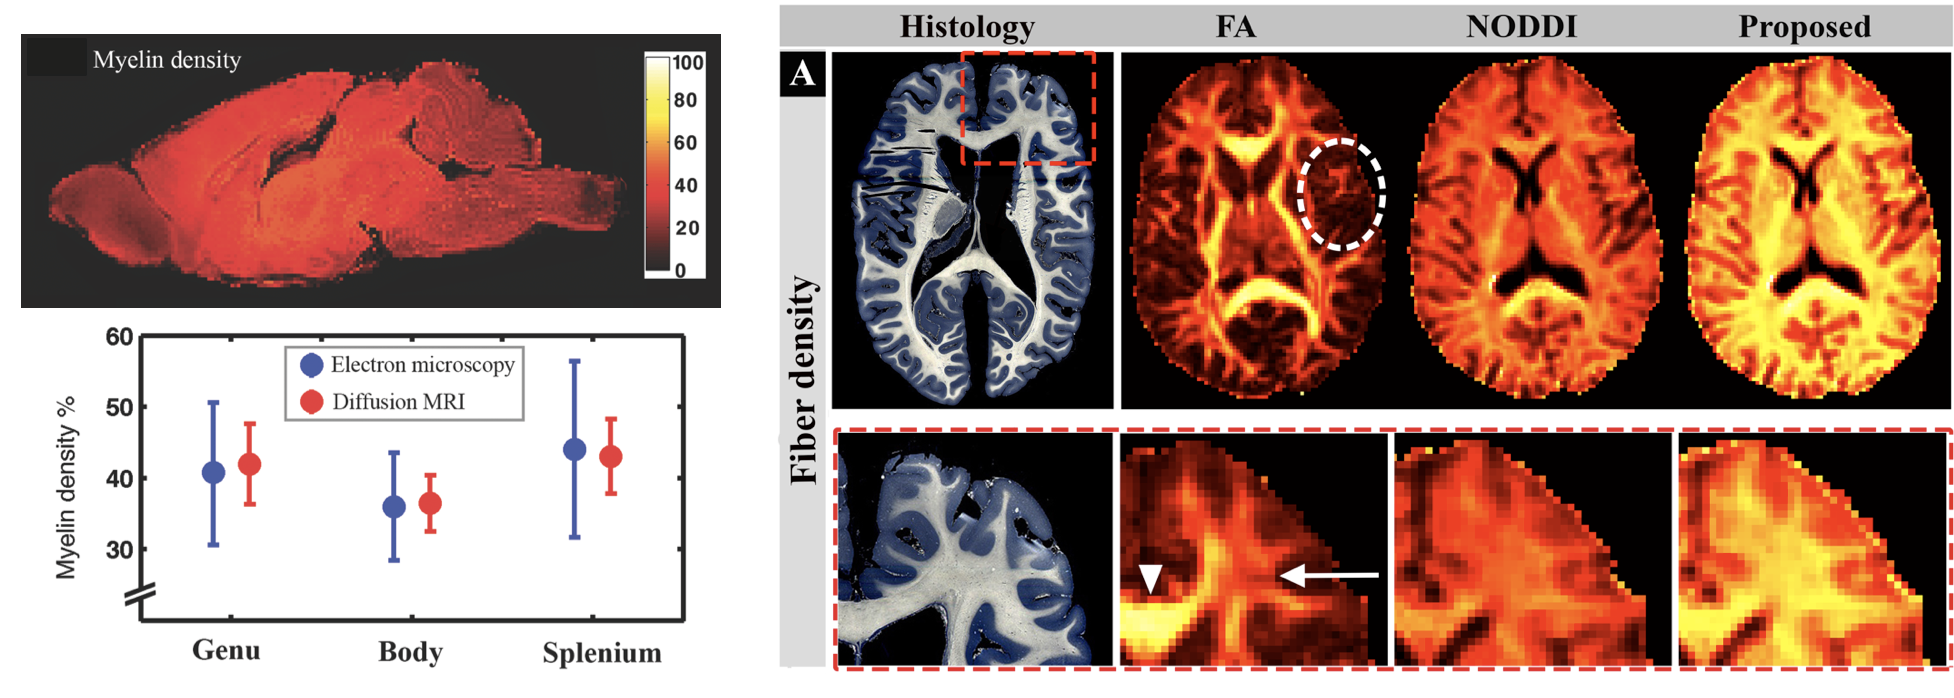
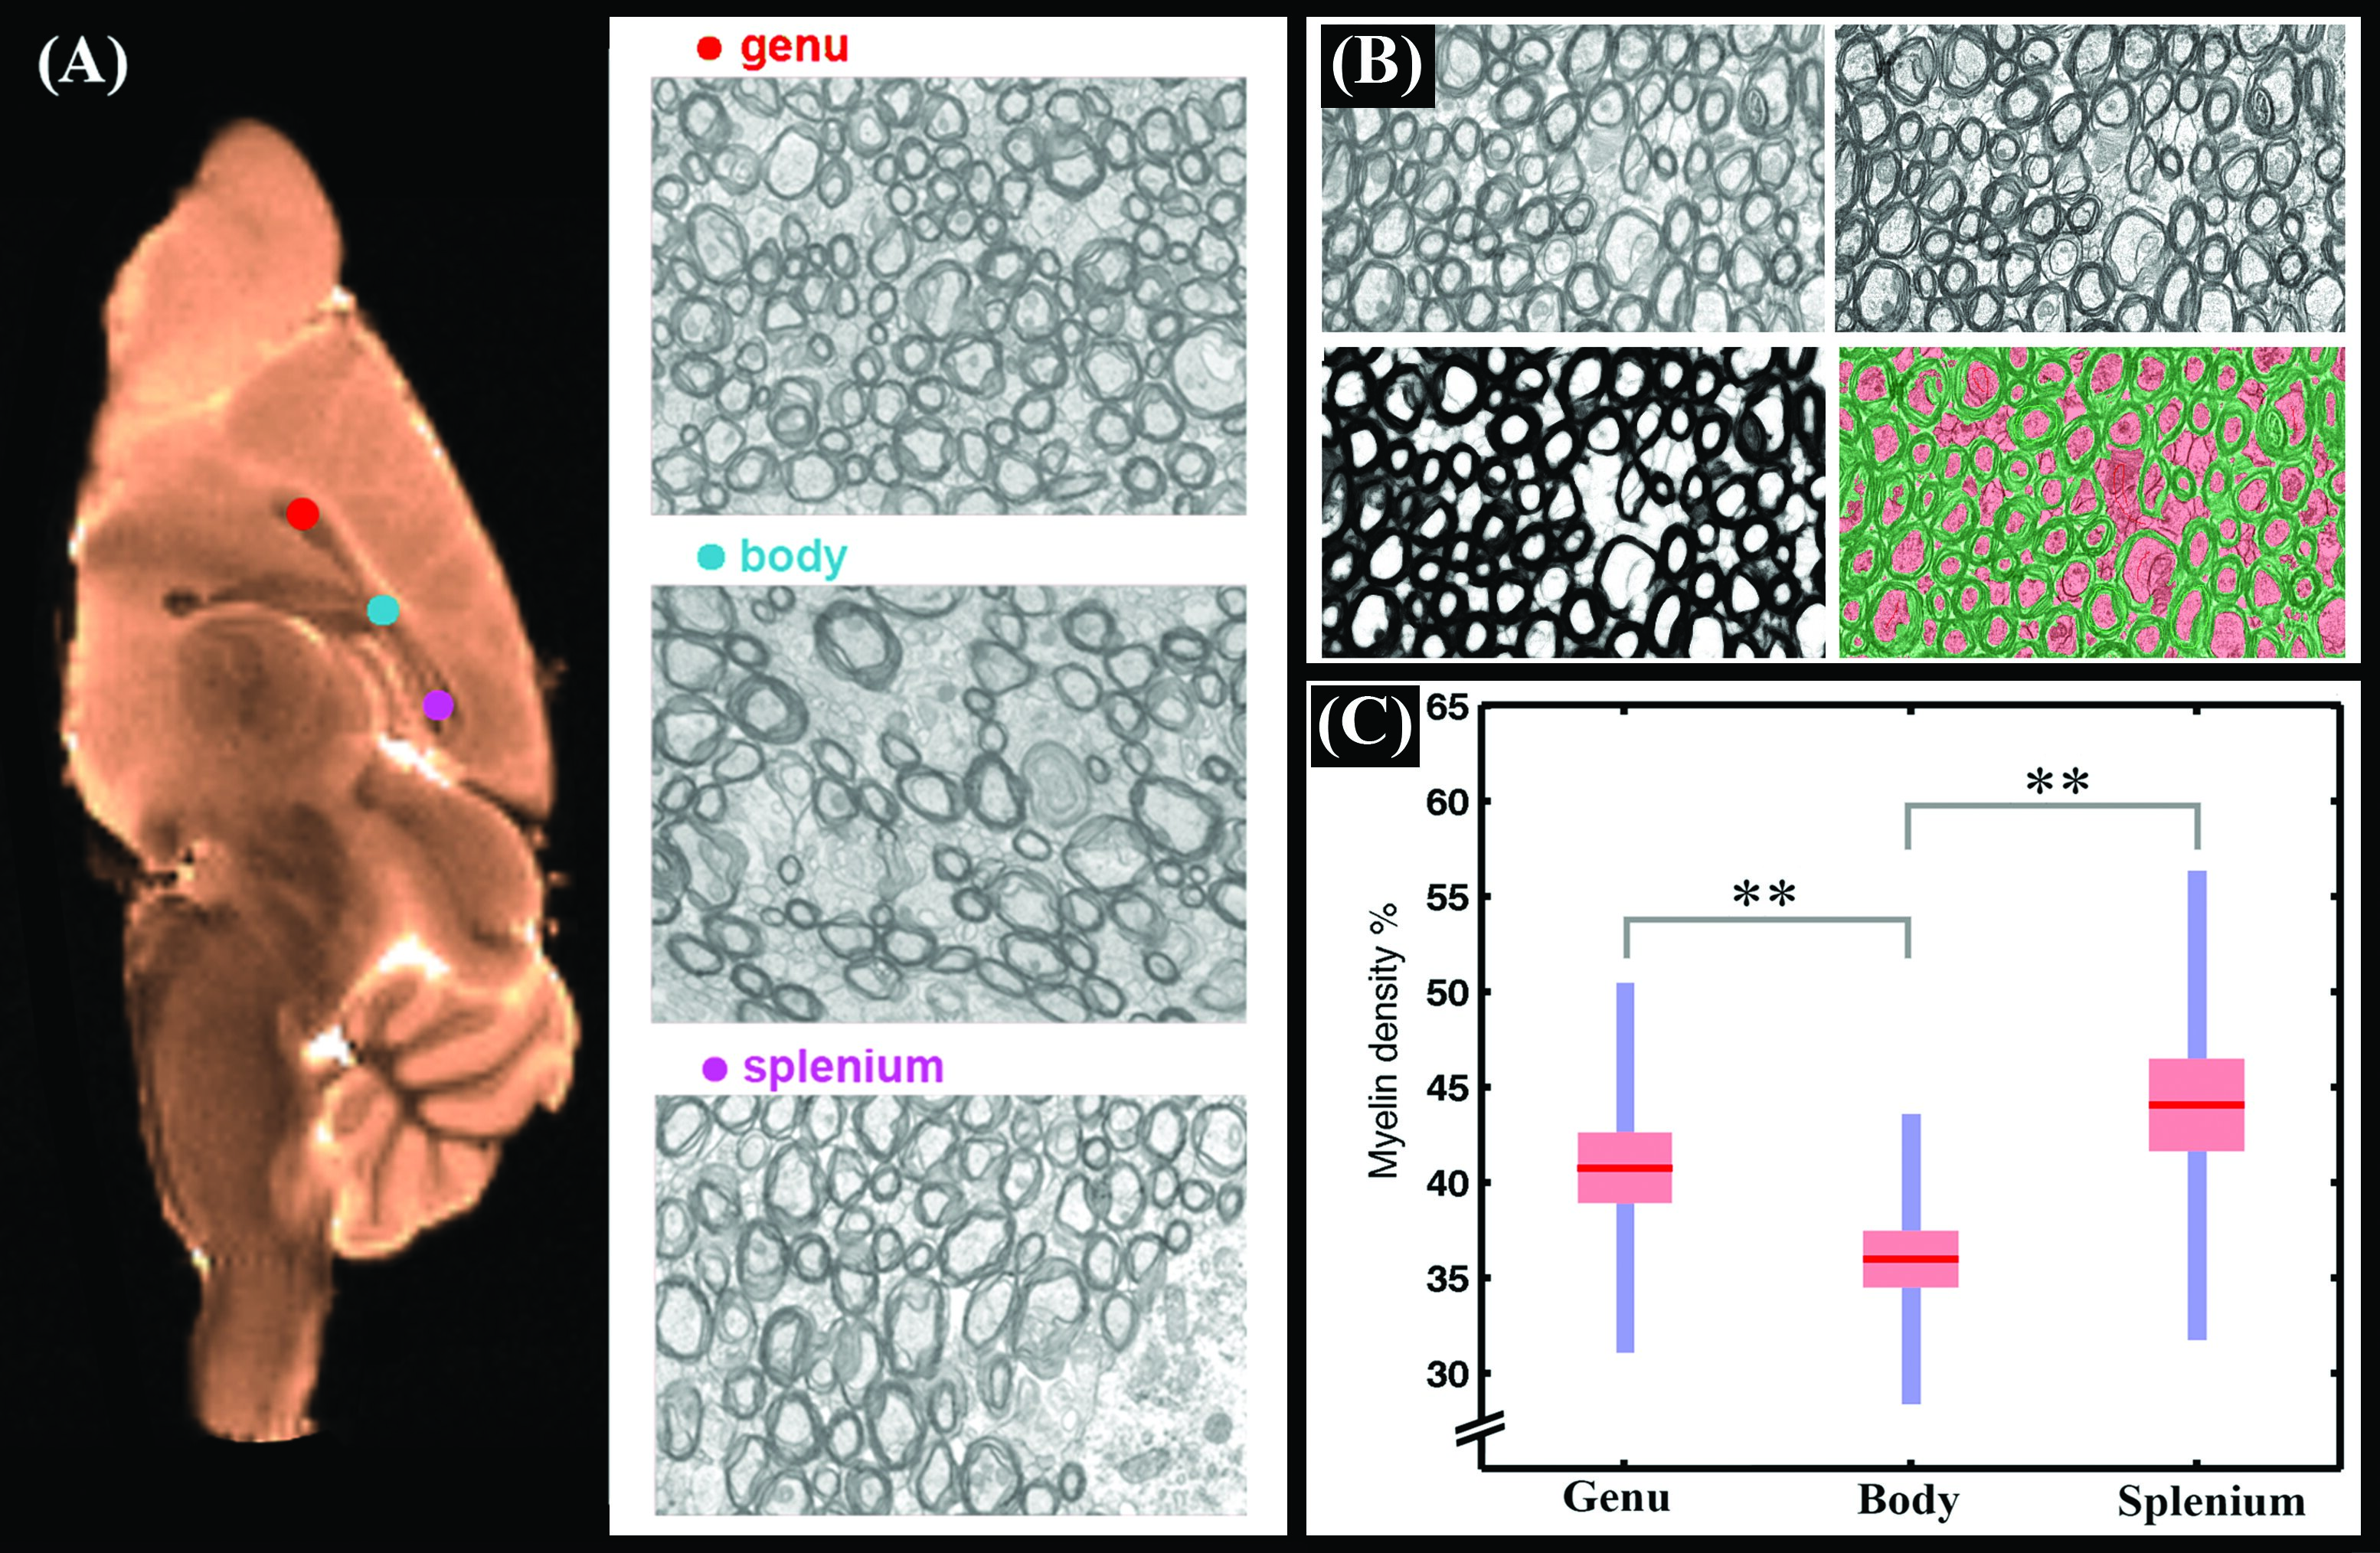
We proposed a model that enabled us to examine whether quantitative density measures of cerebral tissue consistent with histology can be obtained from diffusion magnetic resonance imaging (MRI). By incorporating prior knowledge of myelin and cell membrane densities, absolute tissue density values were estimated from relative intra-cellular and intra-neurite density values obtained from diffusion MRI. In ex vivo mouse brain, estimated myelin densities in different sub-regions of the mouse corpus callosum were almost identical to values obtained from electron microscopy (Diffusion MRI: 42±6%, 36±4% and 43±5%; electron microscopy: 41±10%, 36±8% and 44±12% in genu, body and splenium, respectively). In the human brain, good agreement was observed between estimated fiber density measurements and previously reported values based on electron microscopy. Estimated density values were unaffected by crossing fibers.
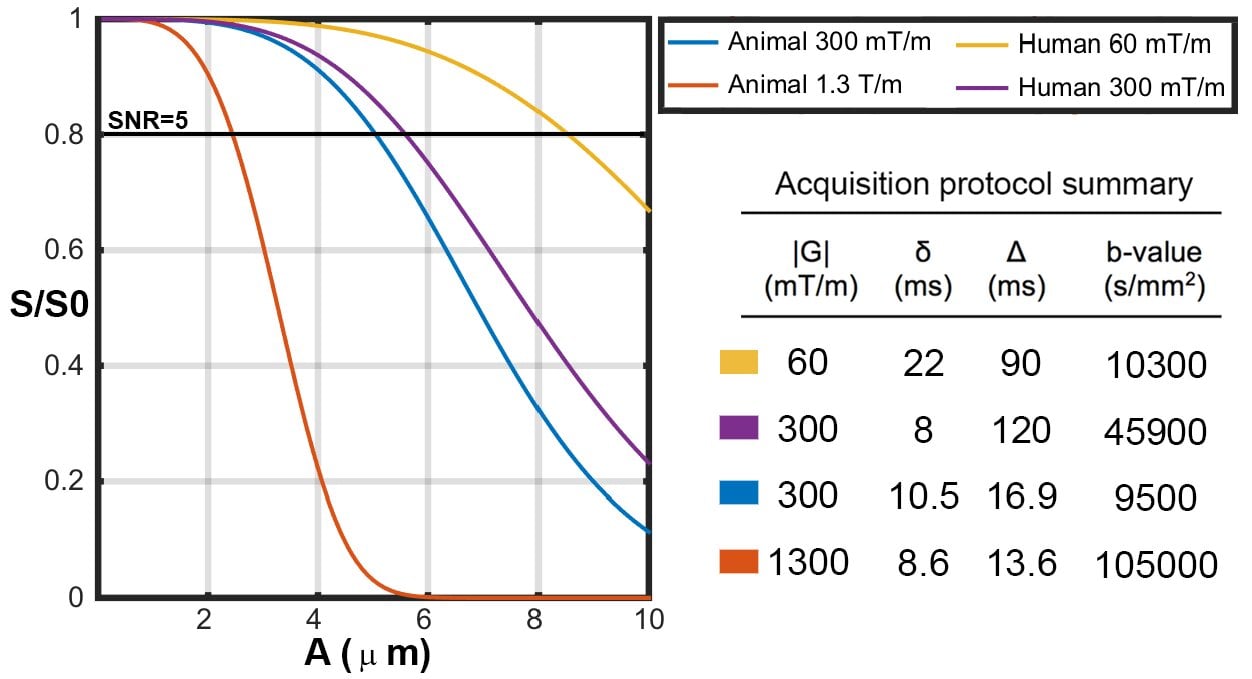
Simulation of PGSE pulse sequence showed that, for the sequence with Gmax=300 mT/m, the attenuation of diffusion-weighted measurement was not detectable (substantially smaller than noise) when an axon diameter index of 1μm was considered. The minimum values of axon diameter index at which the attenuation of the diffusion-weighted measurement was larger than noise, were around 2.5μm for a realistic SNR value (SNR of 20). Sensitivity is dramatically higher with Gmax=1,350 mT/m, even with a low SNR. In general, simulation showed that using a PGSE pulse, with Gmax as high as 1,350 mT/m, the attenuation of diffusion-weighted measurement is only detectable (larger than noise) for axon diameter indices of ~2μm or higher for SNR of 20 (~1.5μm or higher for SNR of 10). Insensitivity of PGSE to small axons could partly explain the observed overestimation of axon diameter indices in our ex vivo experiment.
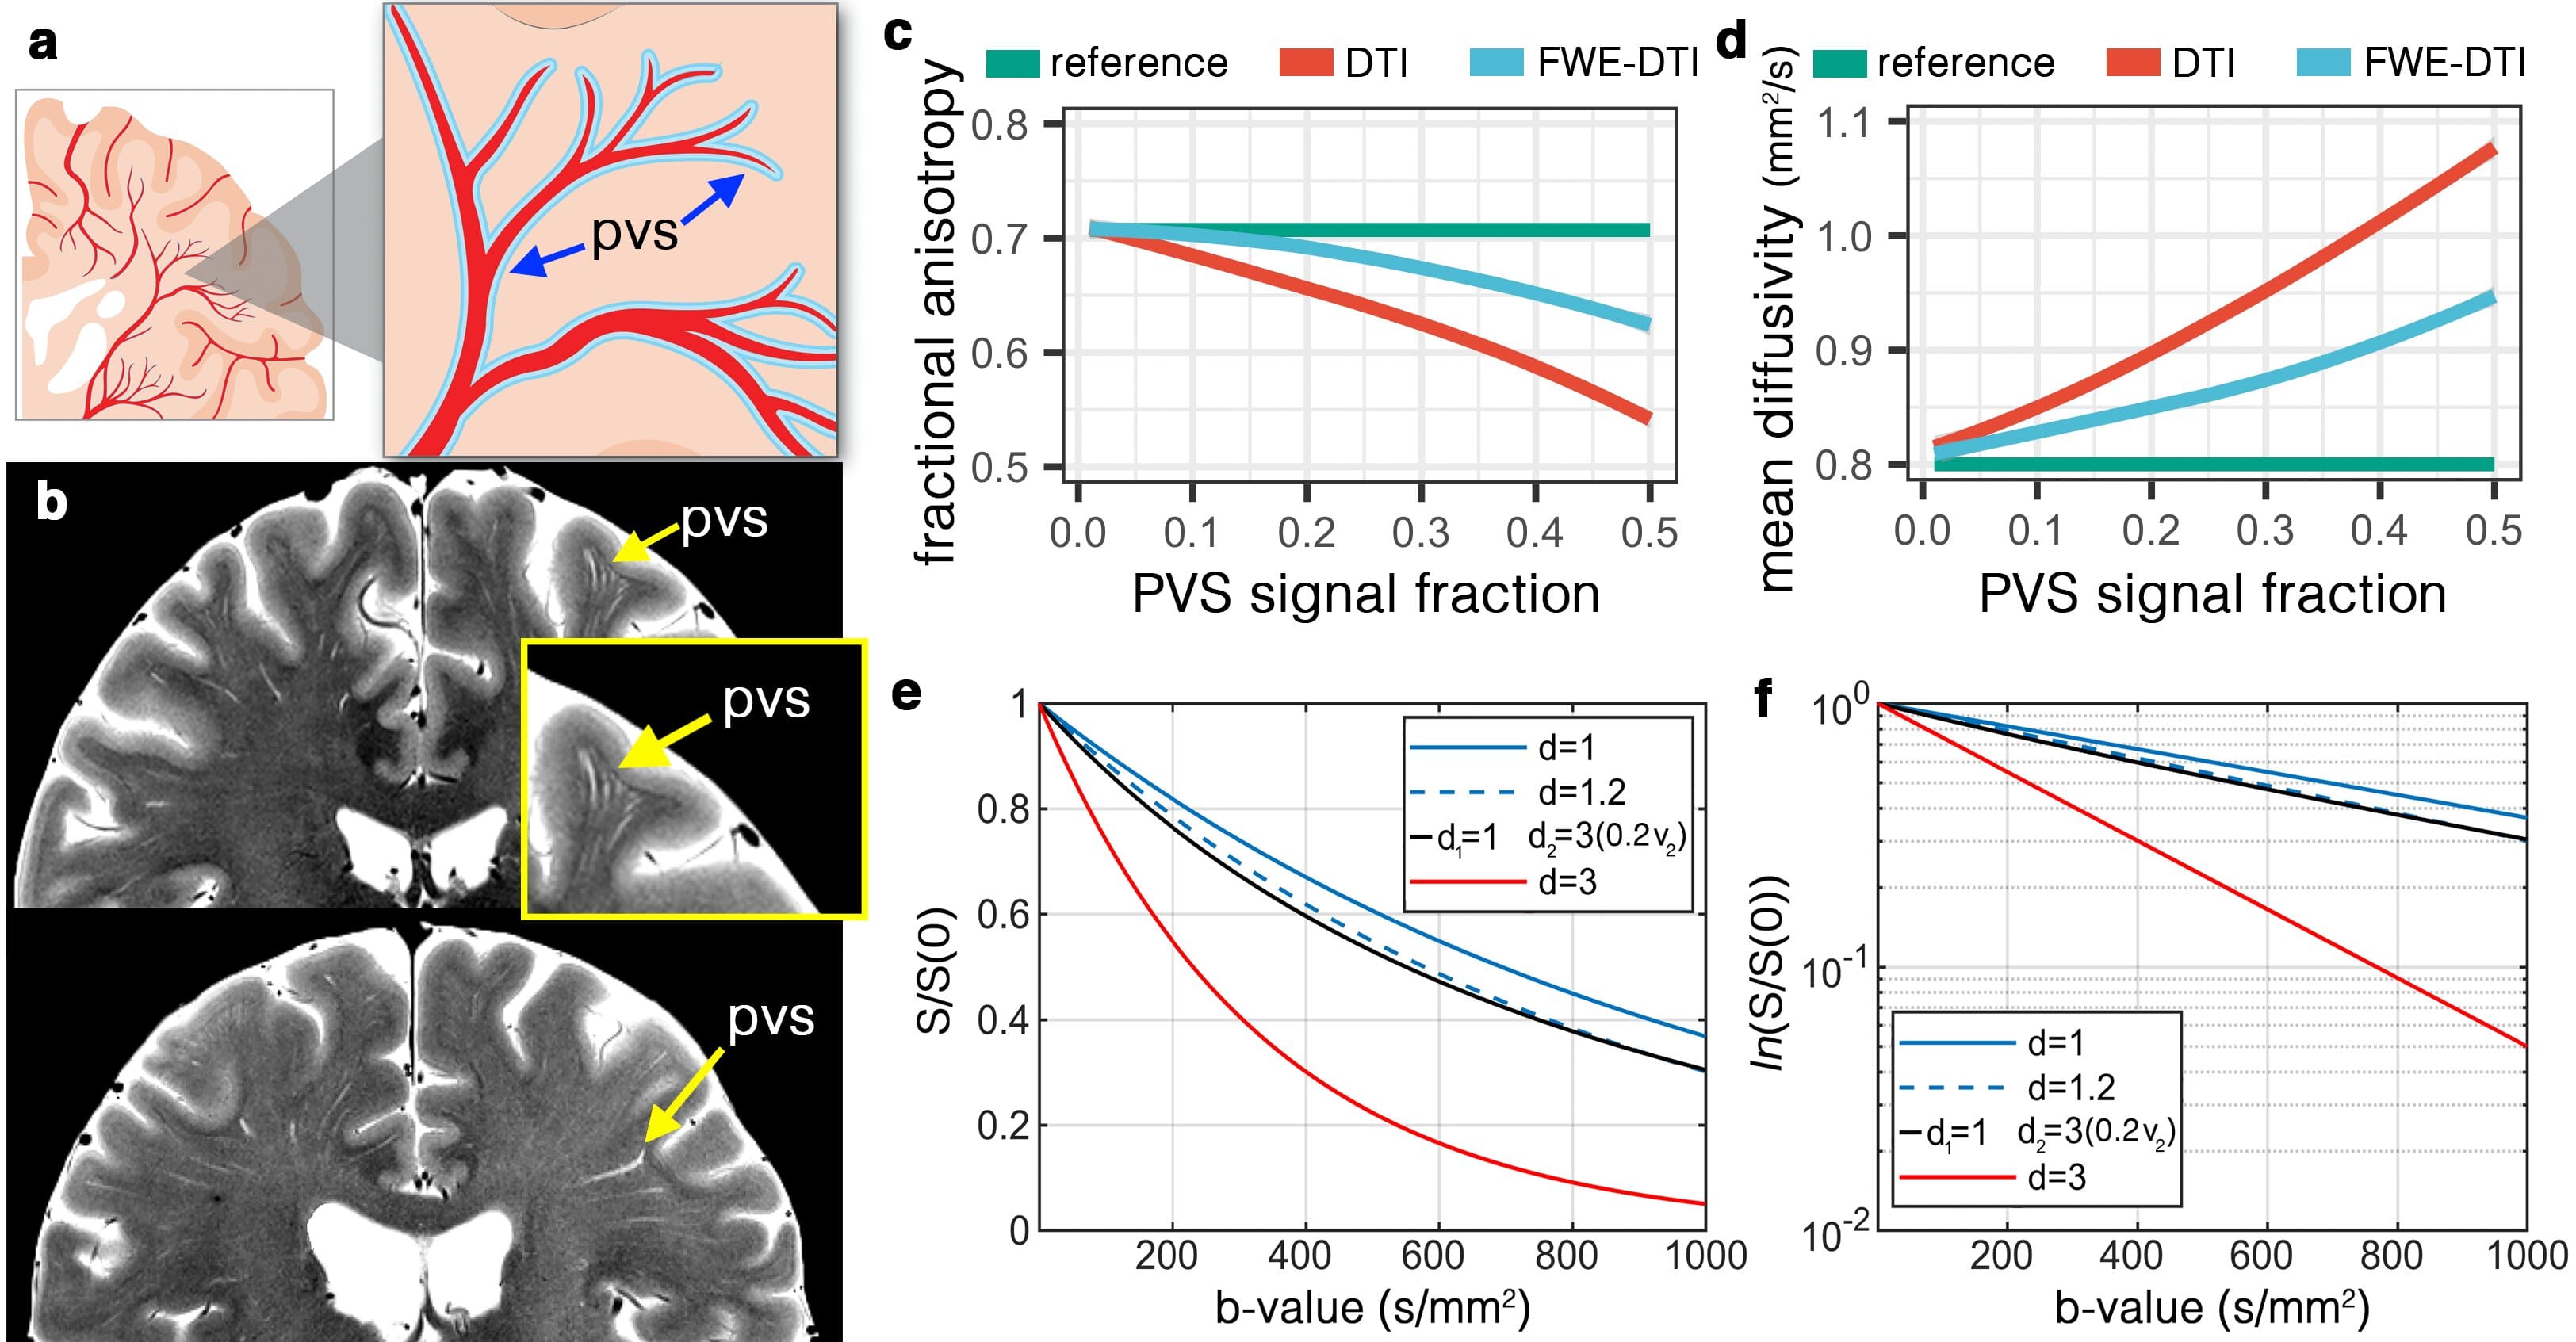
We show that unincorporated anisotropic water in perivascular space (PVS) significantly, and systematically, biases DTI measures, casting new light on the biological validity of many previously reported findings. (a) Schematic view of the PVS. (b) High-resolution turbo spin echo images of two healthy volunteers (above: 32yr old female, below: 56yr old female), scanned at 7T. Note that PVS presents throughout the white matter, with larger diameter PVSs closer to the cortex and smaller diameter as it penetrates deep into the white matter. Systematic bias from PVS on DTI was simulated for the fractional anisotropy (c) and mean diffusivity (d). As PVS increases the amount of bias amplifies. Free-water elimination (DTI-FWE) technique is also included, which is also affected by PVS presence but to a smaller extent. A plot of diffusion MRI signal for 3 different examples of mean diffusivity (d=1 µm2/ms, blue line; d=1.2 µm2/ms, blue dashed line; and d=3 µm2/ms, red line) is illustrated in (e) and the log of the signal is plotted in (f). Note that an increased mean diffusivity from 1 µm2/ms to 1.2 µm2/ms has a similar signal profile as a scenario with no increased diffusivity but 20% of PVS presence (i.e. PVS signal fraction of 0.2; black line).
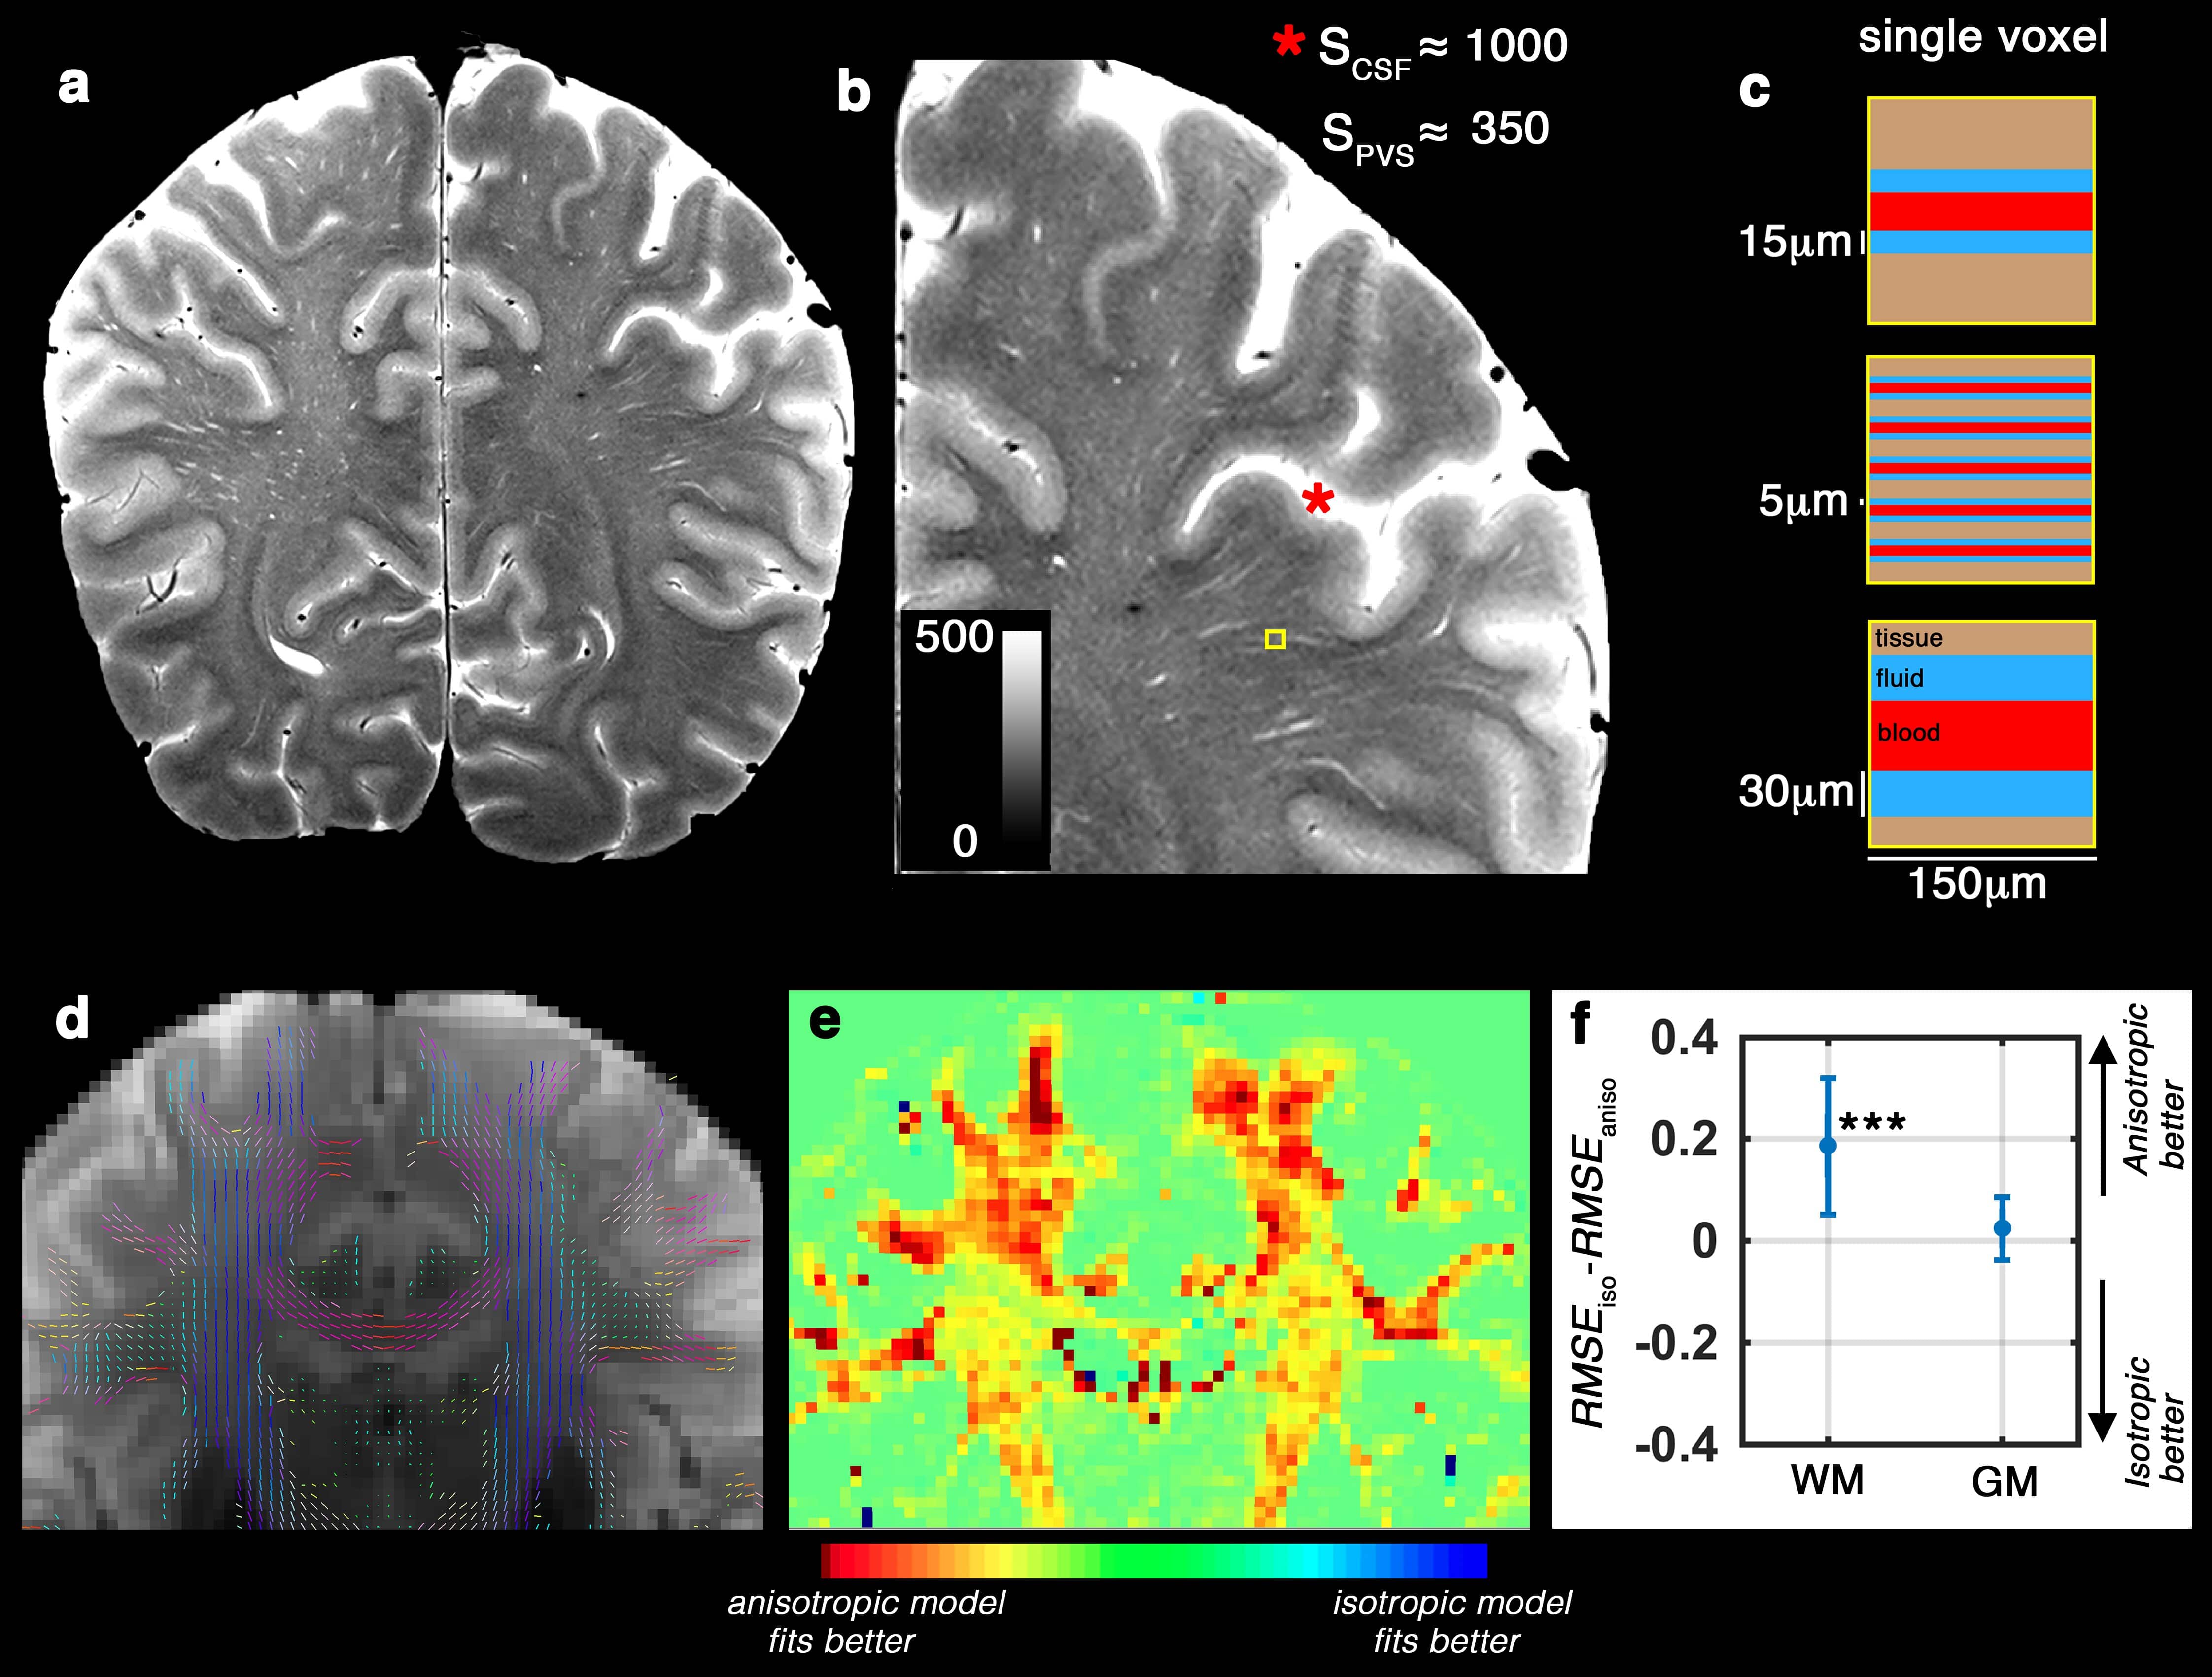
(a) T2-weighted image of a healthy 32 years old volunteer, scanned at 7T with in-plane resolution of 150 µm2. (b) Zooming into a region with high perivascular space (PVS) presence. Signal value of the cerebrospinal fluid (CSF) voxels were much higher than the hyperintense PVS voxels, because PVS voxels partially share the imaging signal with white matter and vessel (Color range is fixed to [0 500], to better visualize the PVS and avoid CSF saturation). Schematic representation of the PVS partial volume for three different possible scenarios are presented in (c). T2-weighted image (unweighted diffusion image of the same subject, scanned at 3T) is shown in (d) and the DTI-derived tensor glyphs of the white matter voxels are overlaid on top. (e) shows the spatial distribution of the fitting error difference (Akaike information criteria scores resulted to a similar heat map) between anisotropic and isotropic models of the PVS fluid diffusion. Note that the highest differences are observed in white matter voxels near cortex, with high PVS presence. The quantitative difference is presented in (f). Same results as (e and f) was obtained from Akaike information criteria test. An anisotropic model fitted better to the data, particularly within the white matter and PVS area.
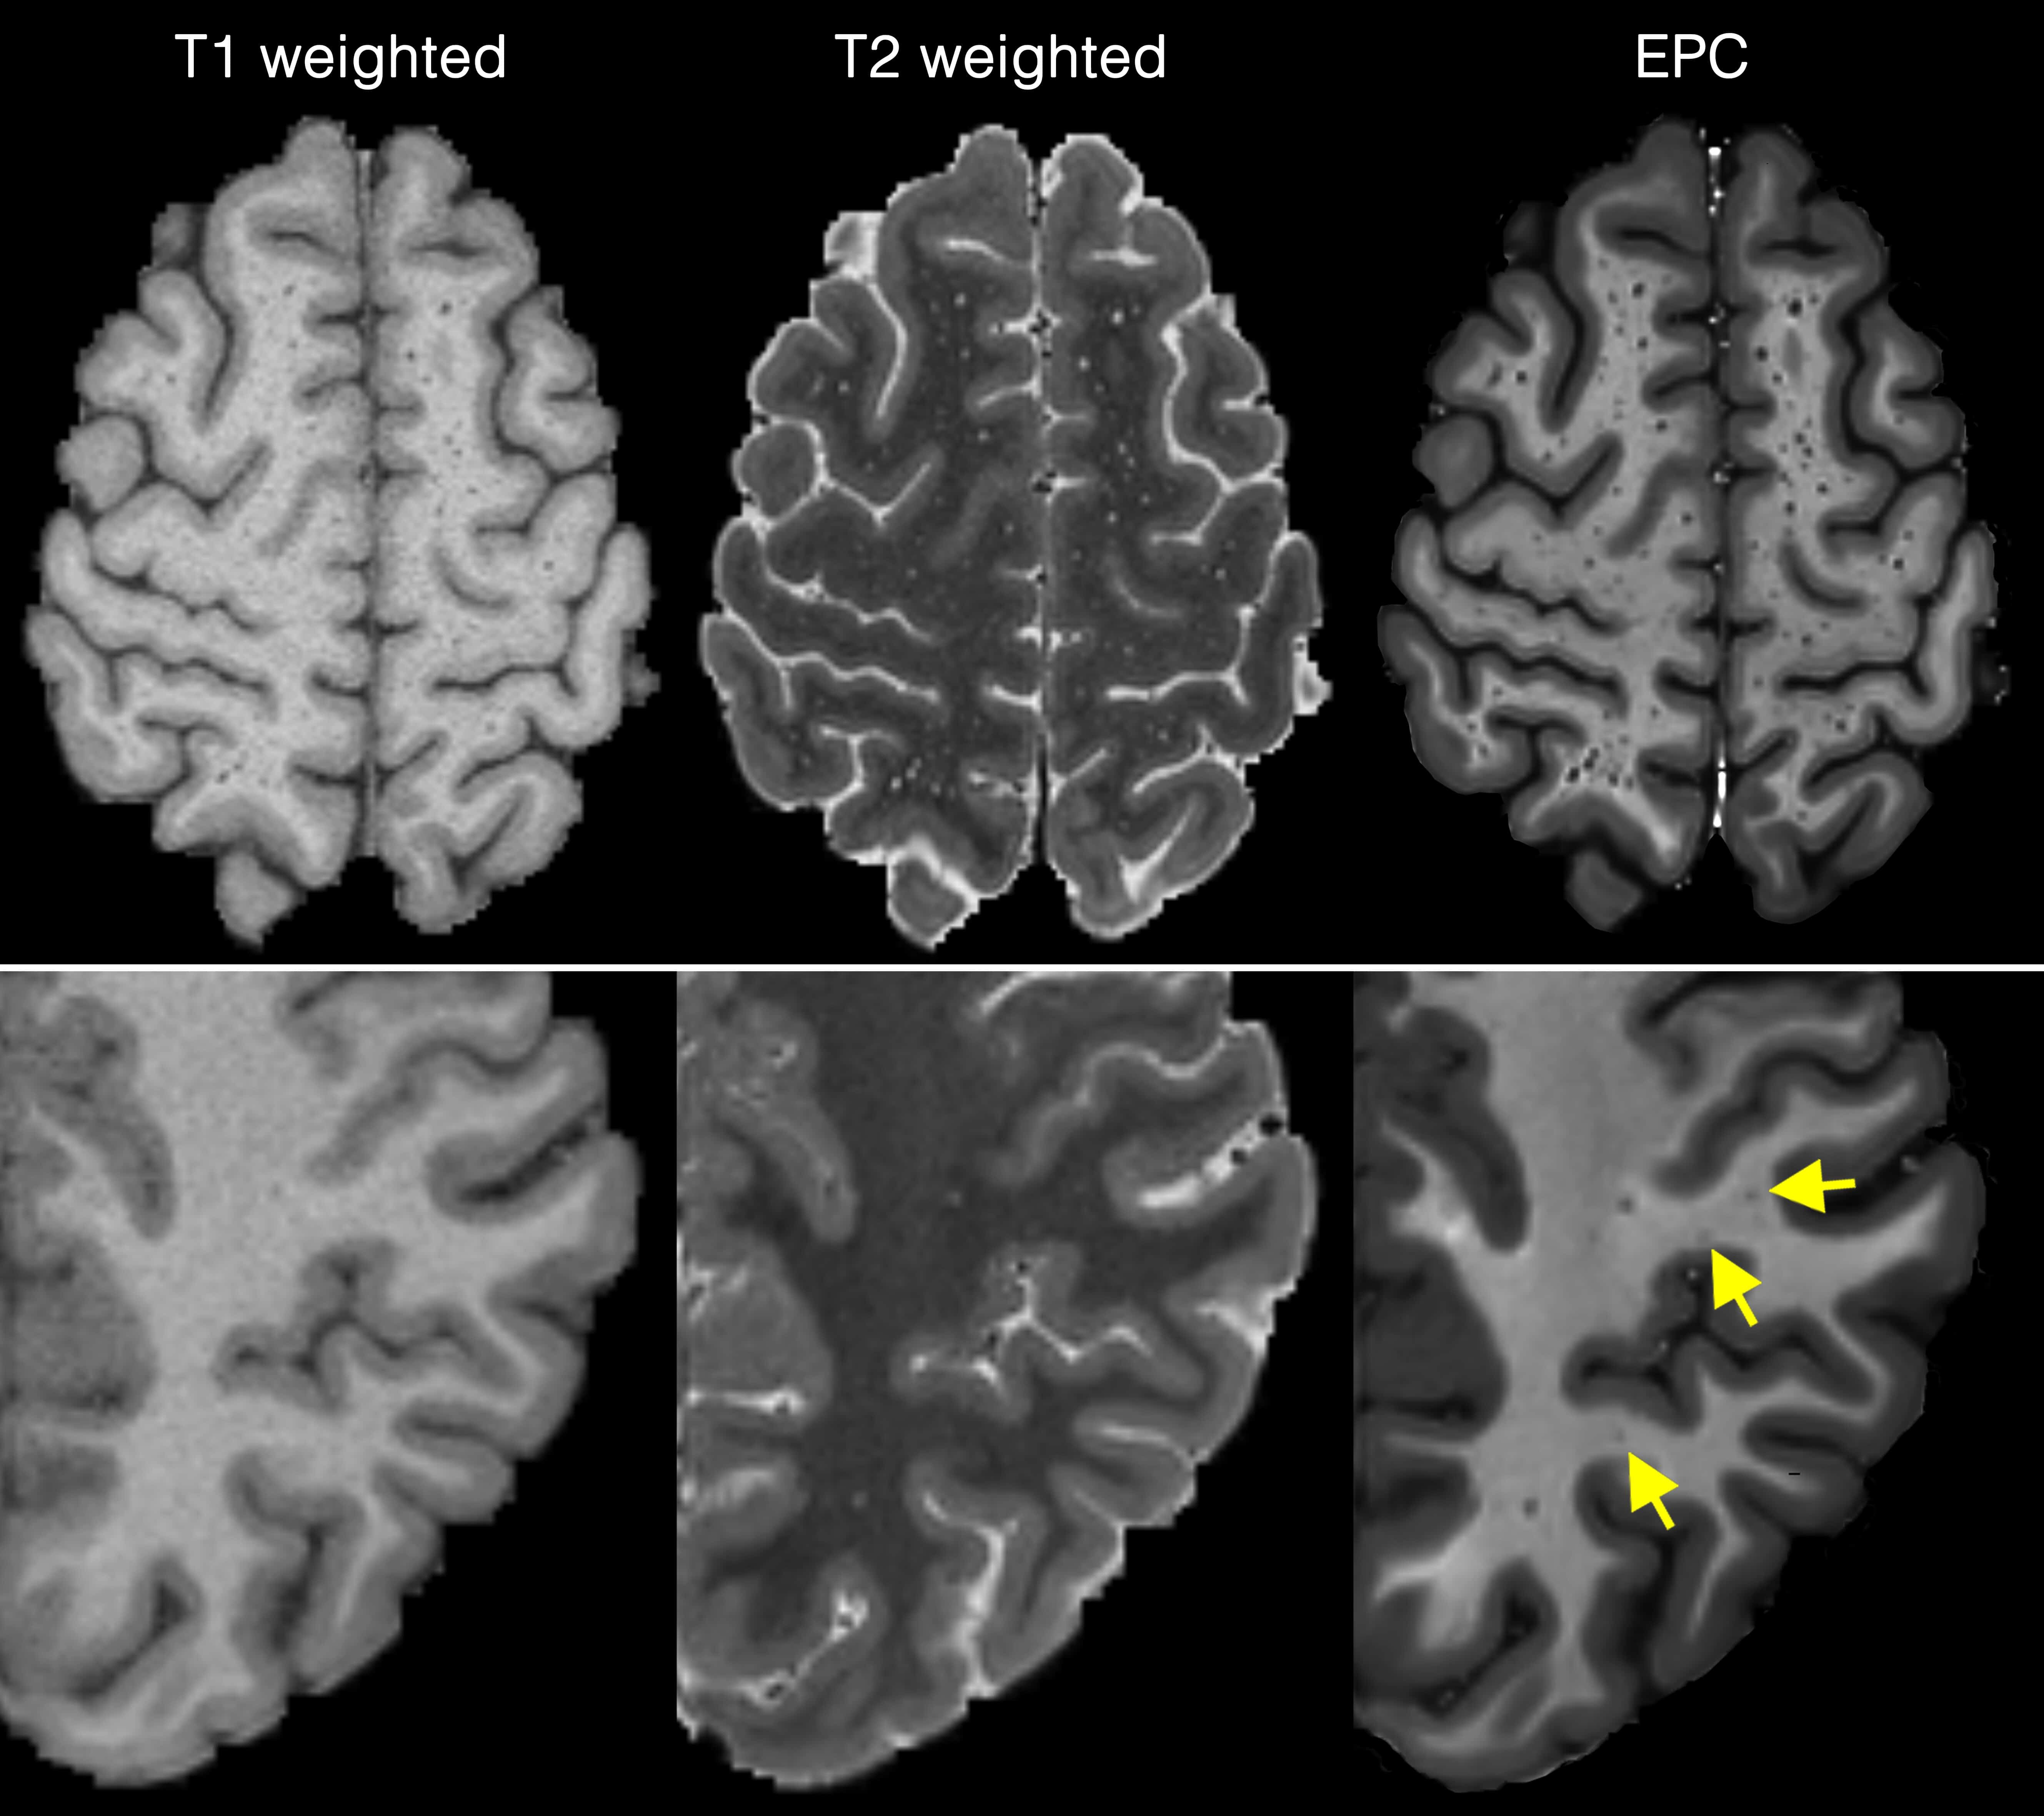
To obtain EPC, first T1w and T2w images were filtered using adaptive non-local mean filtering technique. Non-local mean technique measures the image intensity similarities by taking into account the neighboring voxels in a blockwise fashion. The adaptive non-local mean filtering technique adds a regularization term to account for the Rician noise observed in MRI. The Rician noise of the MRI images, calculated using robust noise estimation technique presented by Wiest-Daessle et al., was used as the noise level for non-local filtering. To preserve PVS voxels while removing the noise, filtering was applied only on high frequency spatial noises. This was achieved by using a filtering patch with a radius of 1 voxel, which removes the noise at a single-voxel level and preserves signal intensities that are spatially repeated. Finally, EPC was obtained by dividing filtered images (i.e. T1w/T2w).
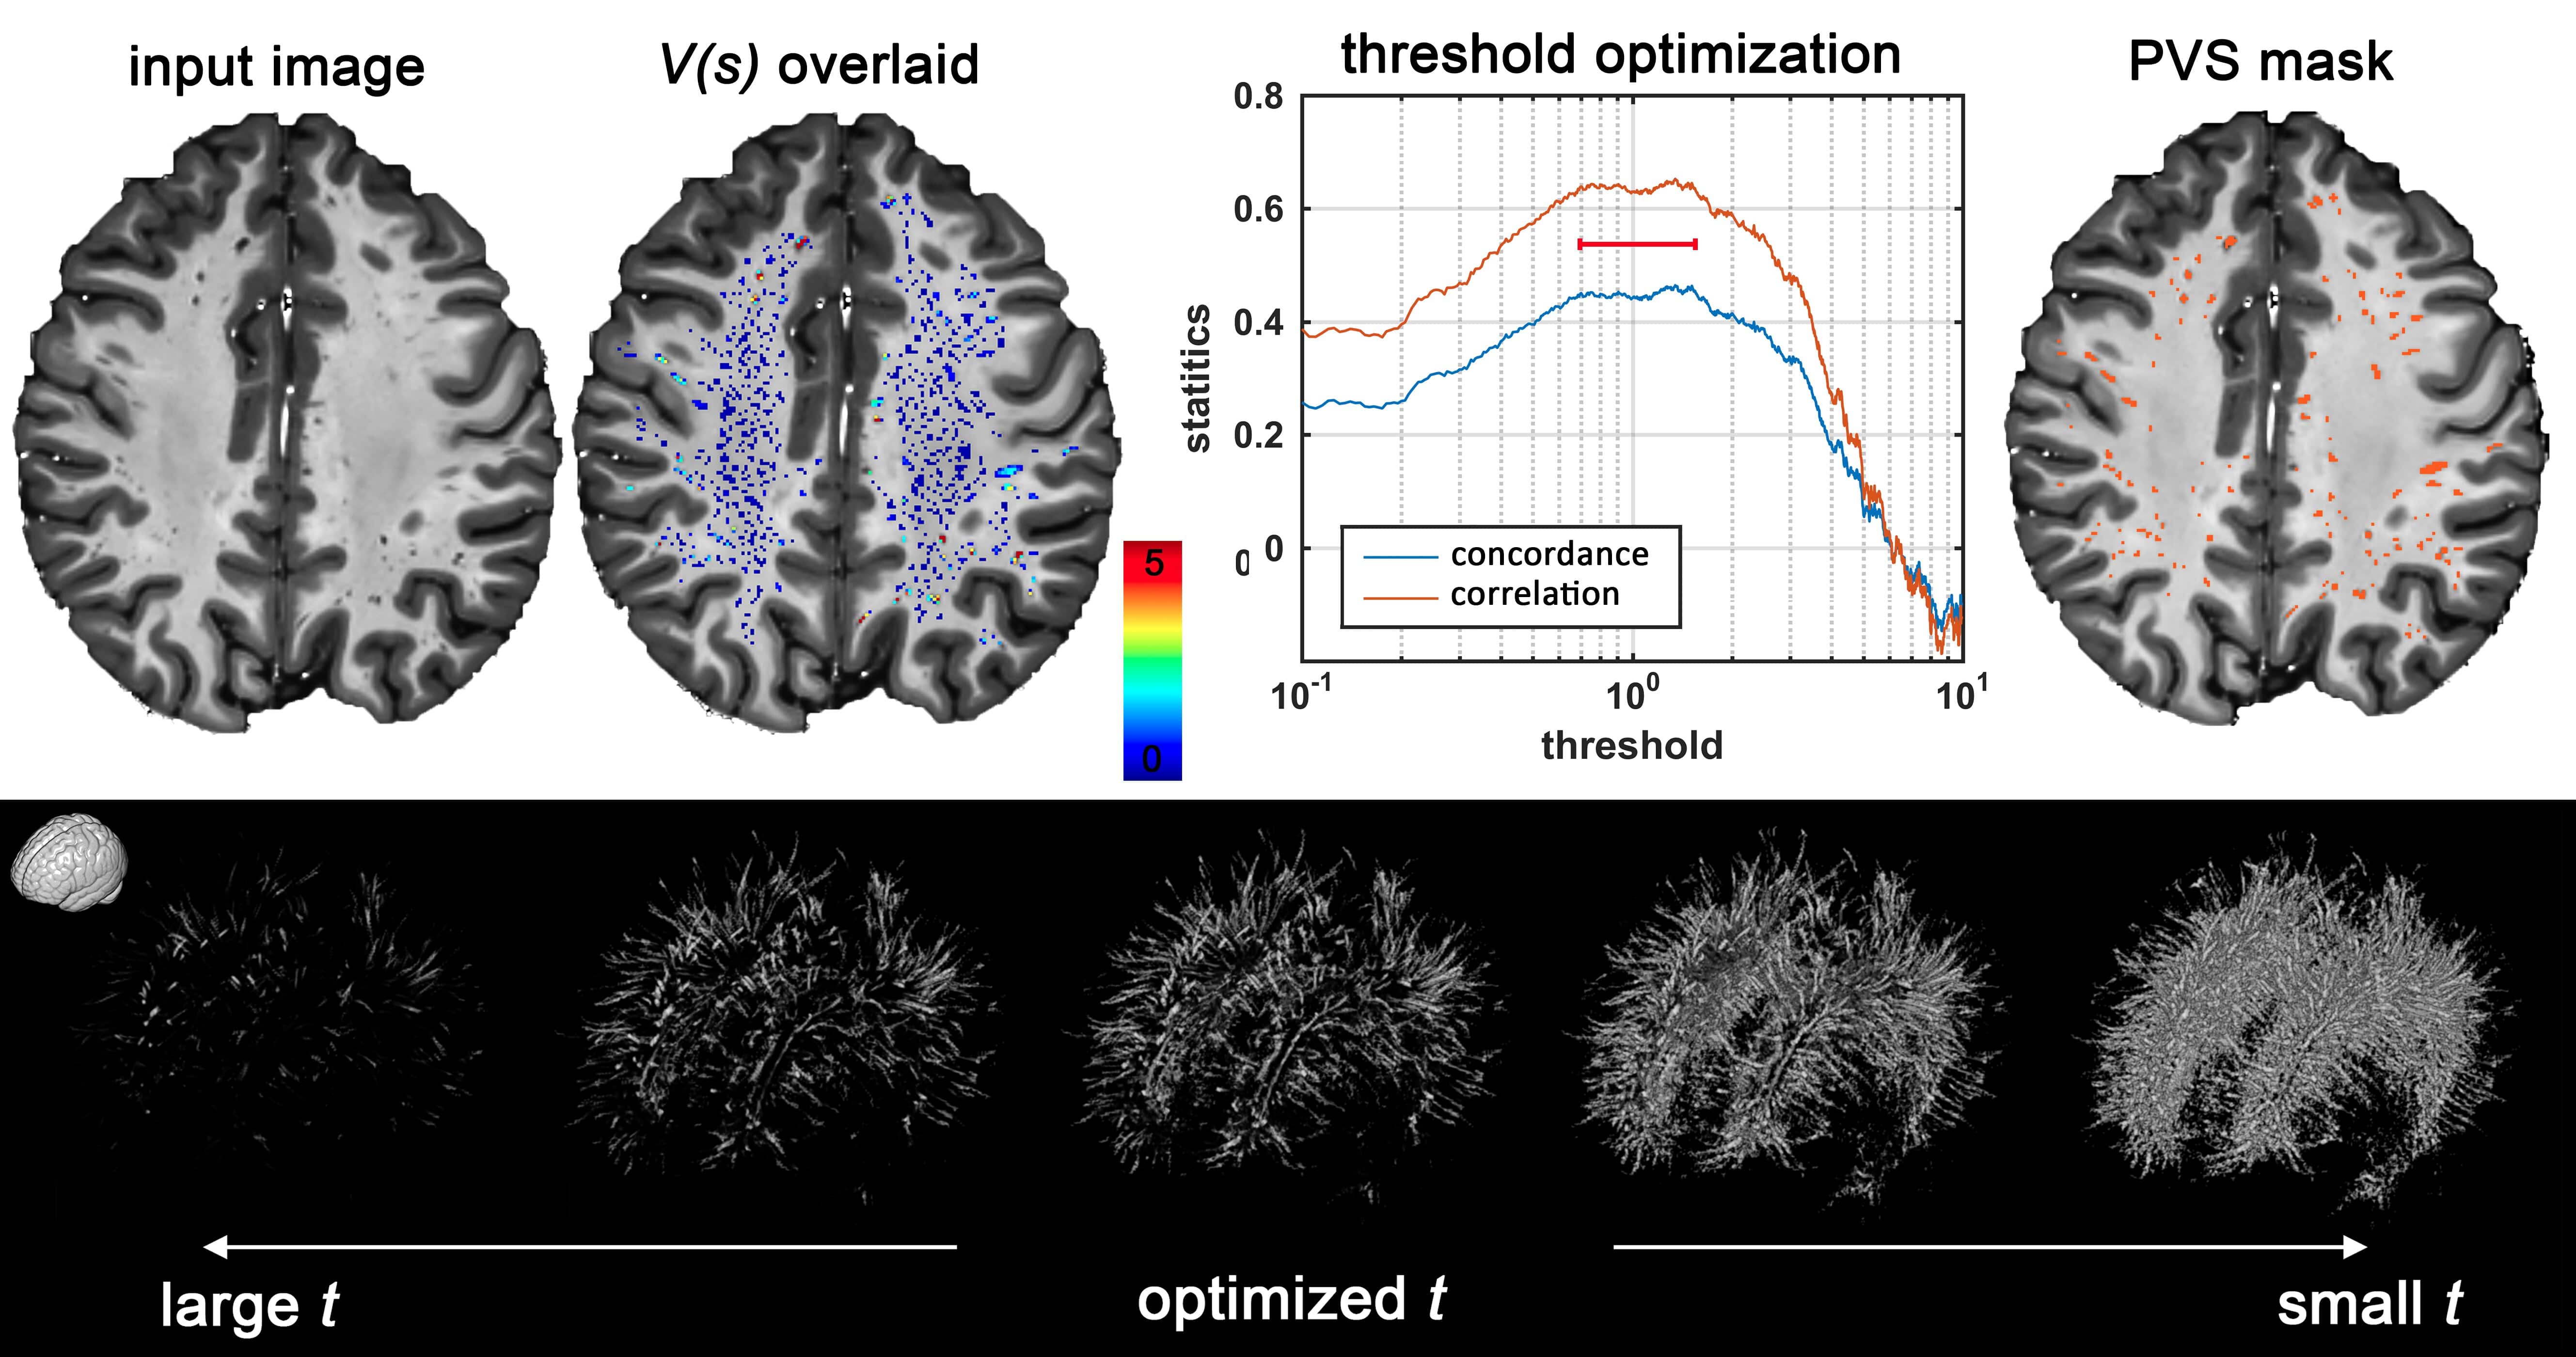
We constructed a framework for PVS quantification and mapping using MRI, which can be applied to T1w, T2w or EPC. First, we apply Frangi filter to the input images to estimate vesselness, derived from eigenvectors of the Hessian matrix of the image. In order to obtain a binary mask of PVS regions, the vesselness map should be thresholded. The binary mask enables automated PVS counting, volumetric, and spatial distribution analysis. Given that the vesselness value could vary across modalities, the threshold was optimized for each input image separately. We used the number of PVS counted by the experts for threshold optimization because of the absence of a ground truth. Optimum thresholds were found by maximizing the concordance with the expert visual reading.
For myelin mapping we used a fast random forest classifier (a multi-thread version of random forest) to obtain a probability map ranging from 0 to 1. Then a threshold of 0.5 was applied to obtain the output binary image (myelin versus not myelin). Random forest classification yielded accurate segmentation with a low out-of-bag error (<1%). Out-of-bag error is an unbiased estimate of classification error in random forest classification. A precision and recall of ~1 (i.e., almost 100% success) were also obtained from training data. Precision and recall present how many selected voxels are relevant or how many relevant voxels are selected, respectively.
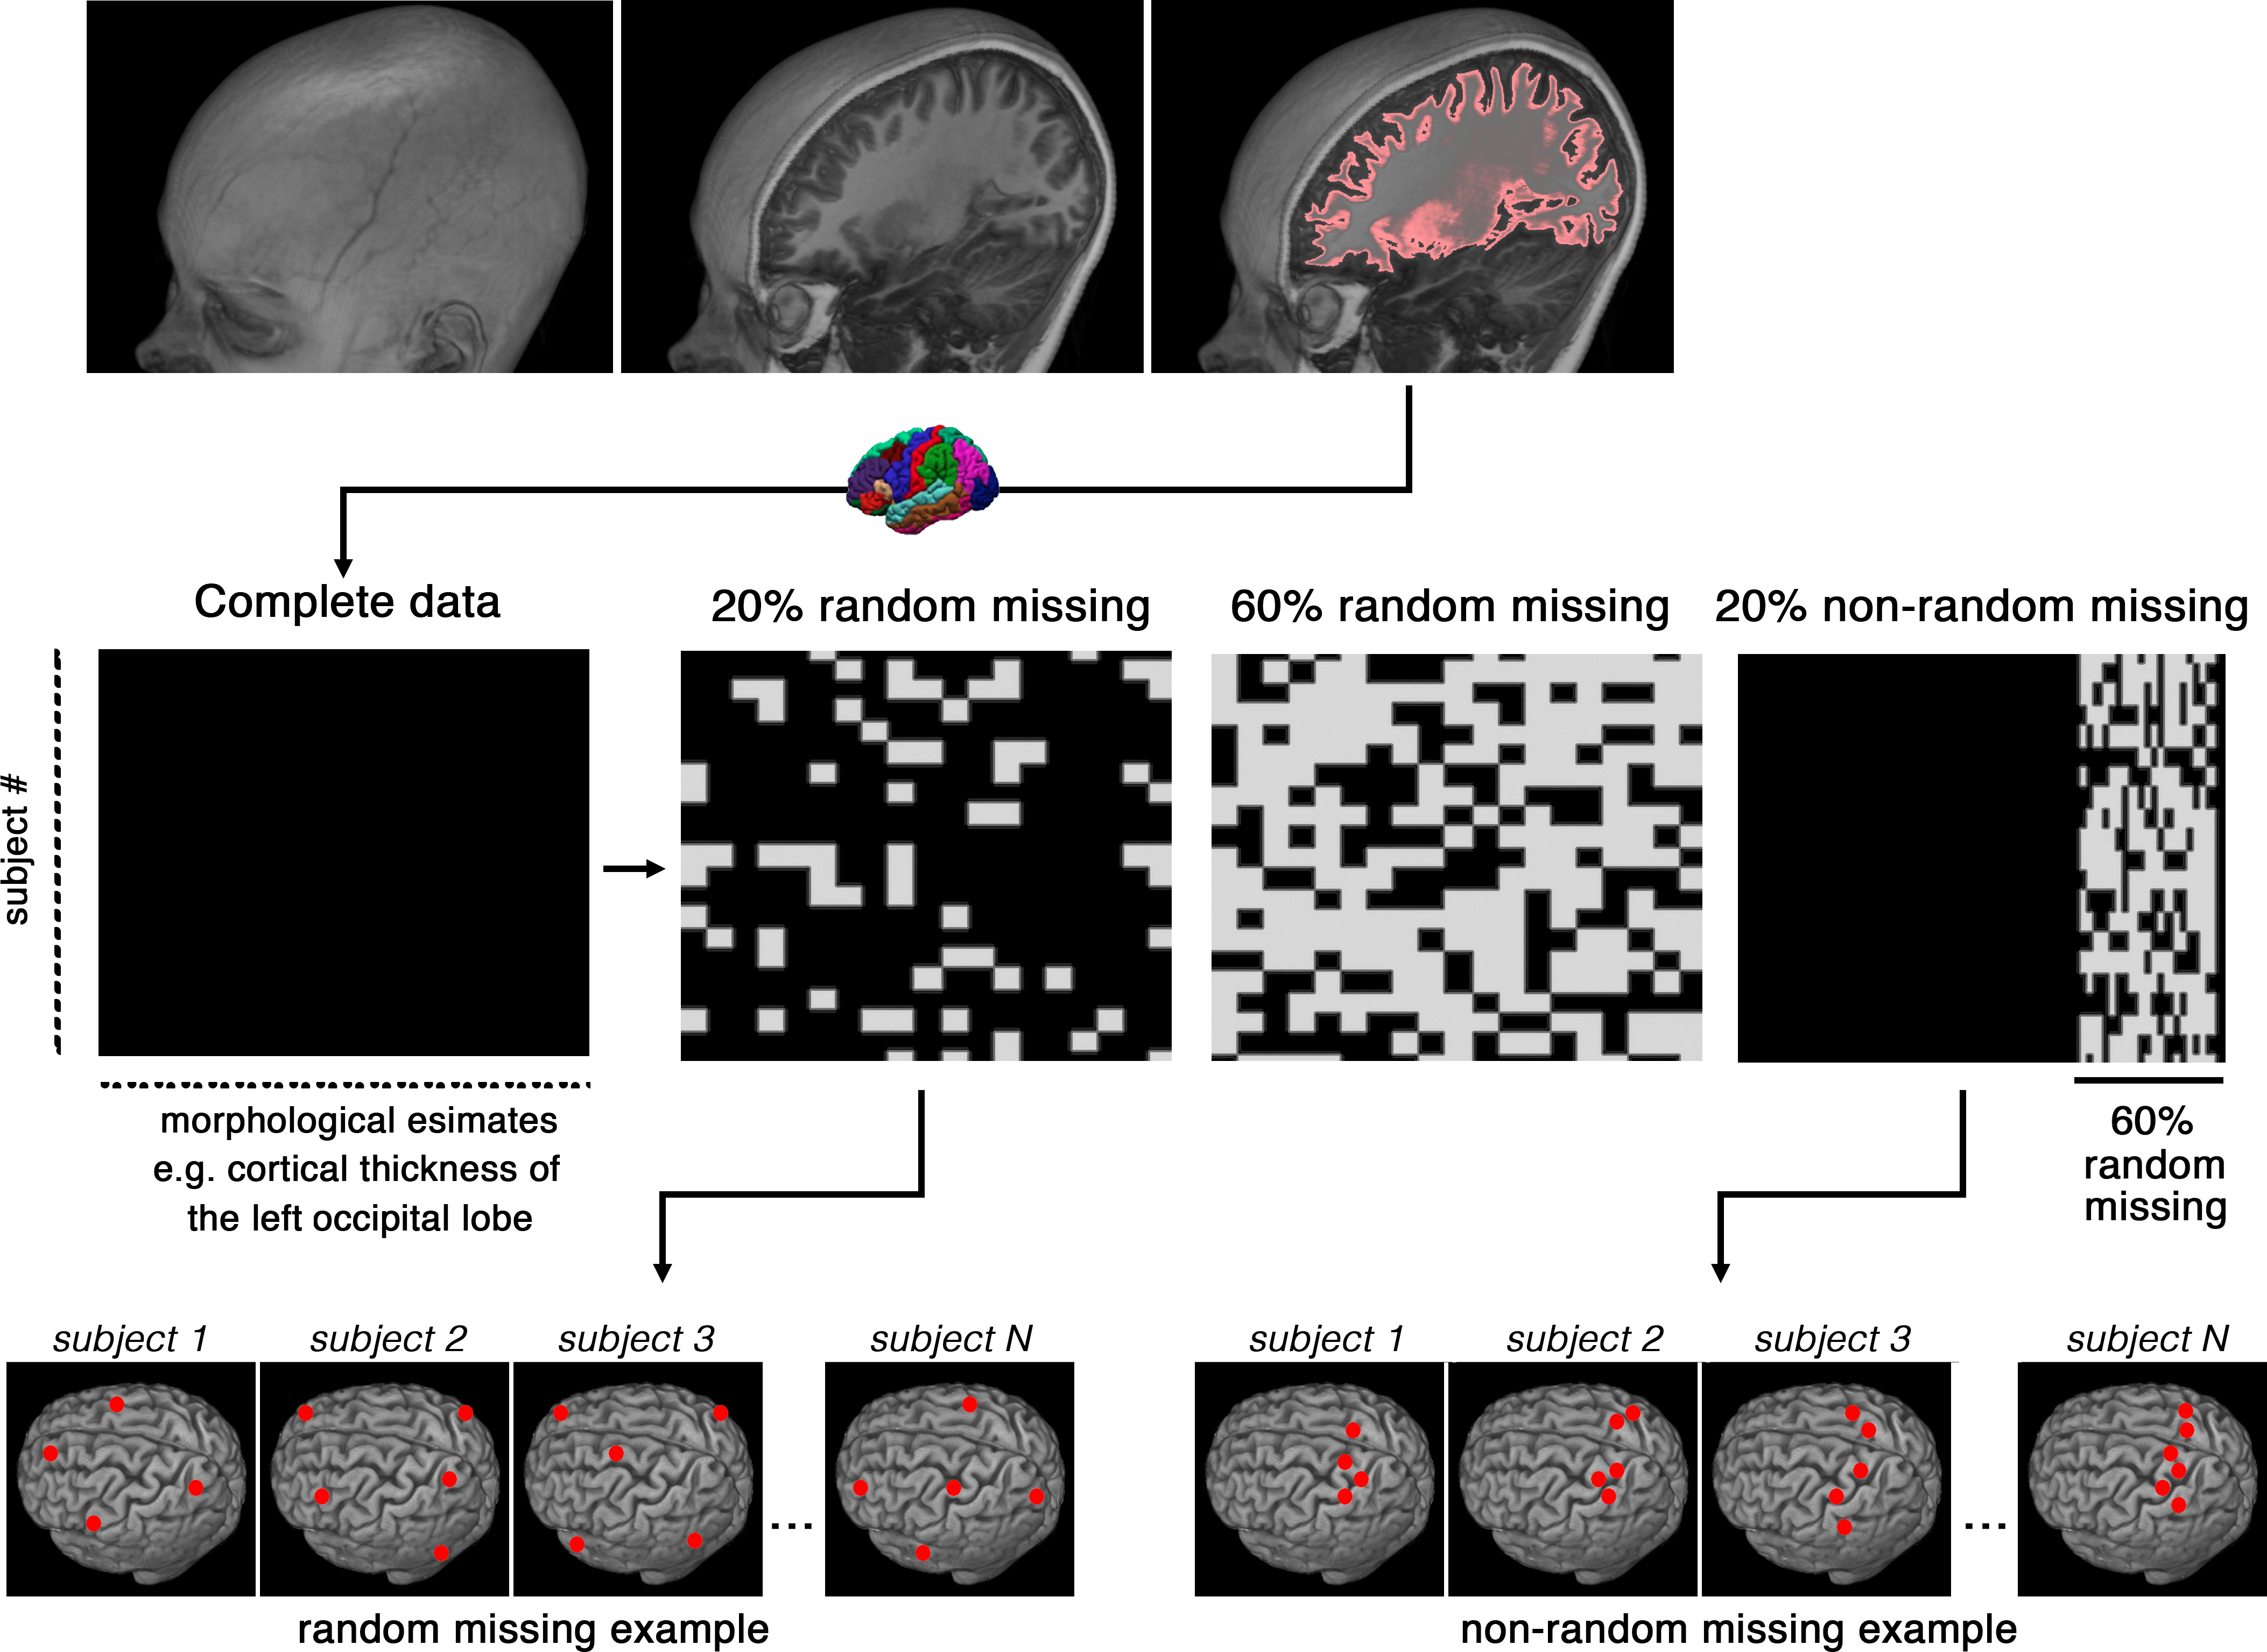
Results from brain segmentation techniques are intrinsically prone to certain degrees of variability, mainly as results of suboptimal segmentation. To reduce this inherent variability, the errors are often identified through visual inspection and then corrected (semi)manually. Identification and correction of incorrect segmentation could be very expensive for large-scale studies. While identification of the incorrect results can be done relatively fast even with manual inspection, the correction step is extremely time-consuming, as it requires training staff to perform laborious manual corrections. Here we frame the correction phase of this problem as a missing data problem. Instead of manually adjusting the segmentation outputs, our computational approach aims to derive accurate morphological measures by machine learning imputation. Data imputation techniques may be used to replace missing or incorrect region average values with carefully chosen imputed values, all of which are computed based on other available multivariate information. We examined our approach of correcting segmentation outputs on a cohort of 970 subjects, which were undergone an extensive, time-consuming, manual post-segmentation correction. A random forest imputation technique recovered the gold standard results with a significant accuracy (r=0.93, p<0.0001; when 30% of the segmentations were considered incorrect in a non-random fashion). The random forest technique proved to be most effective for big data studies (N>250).
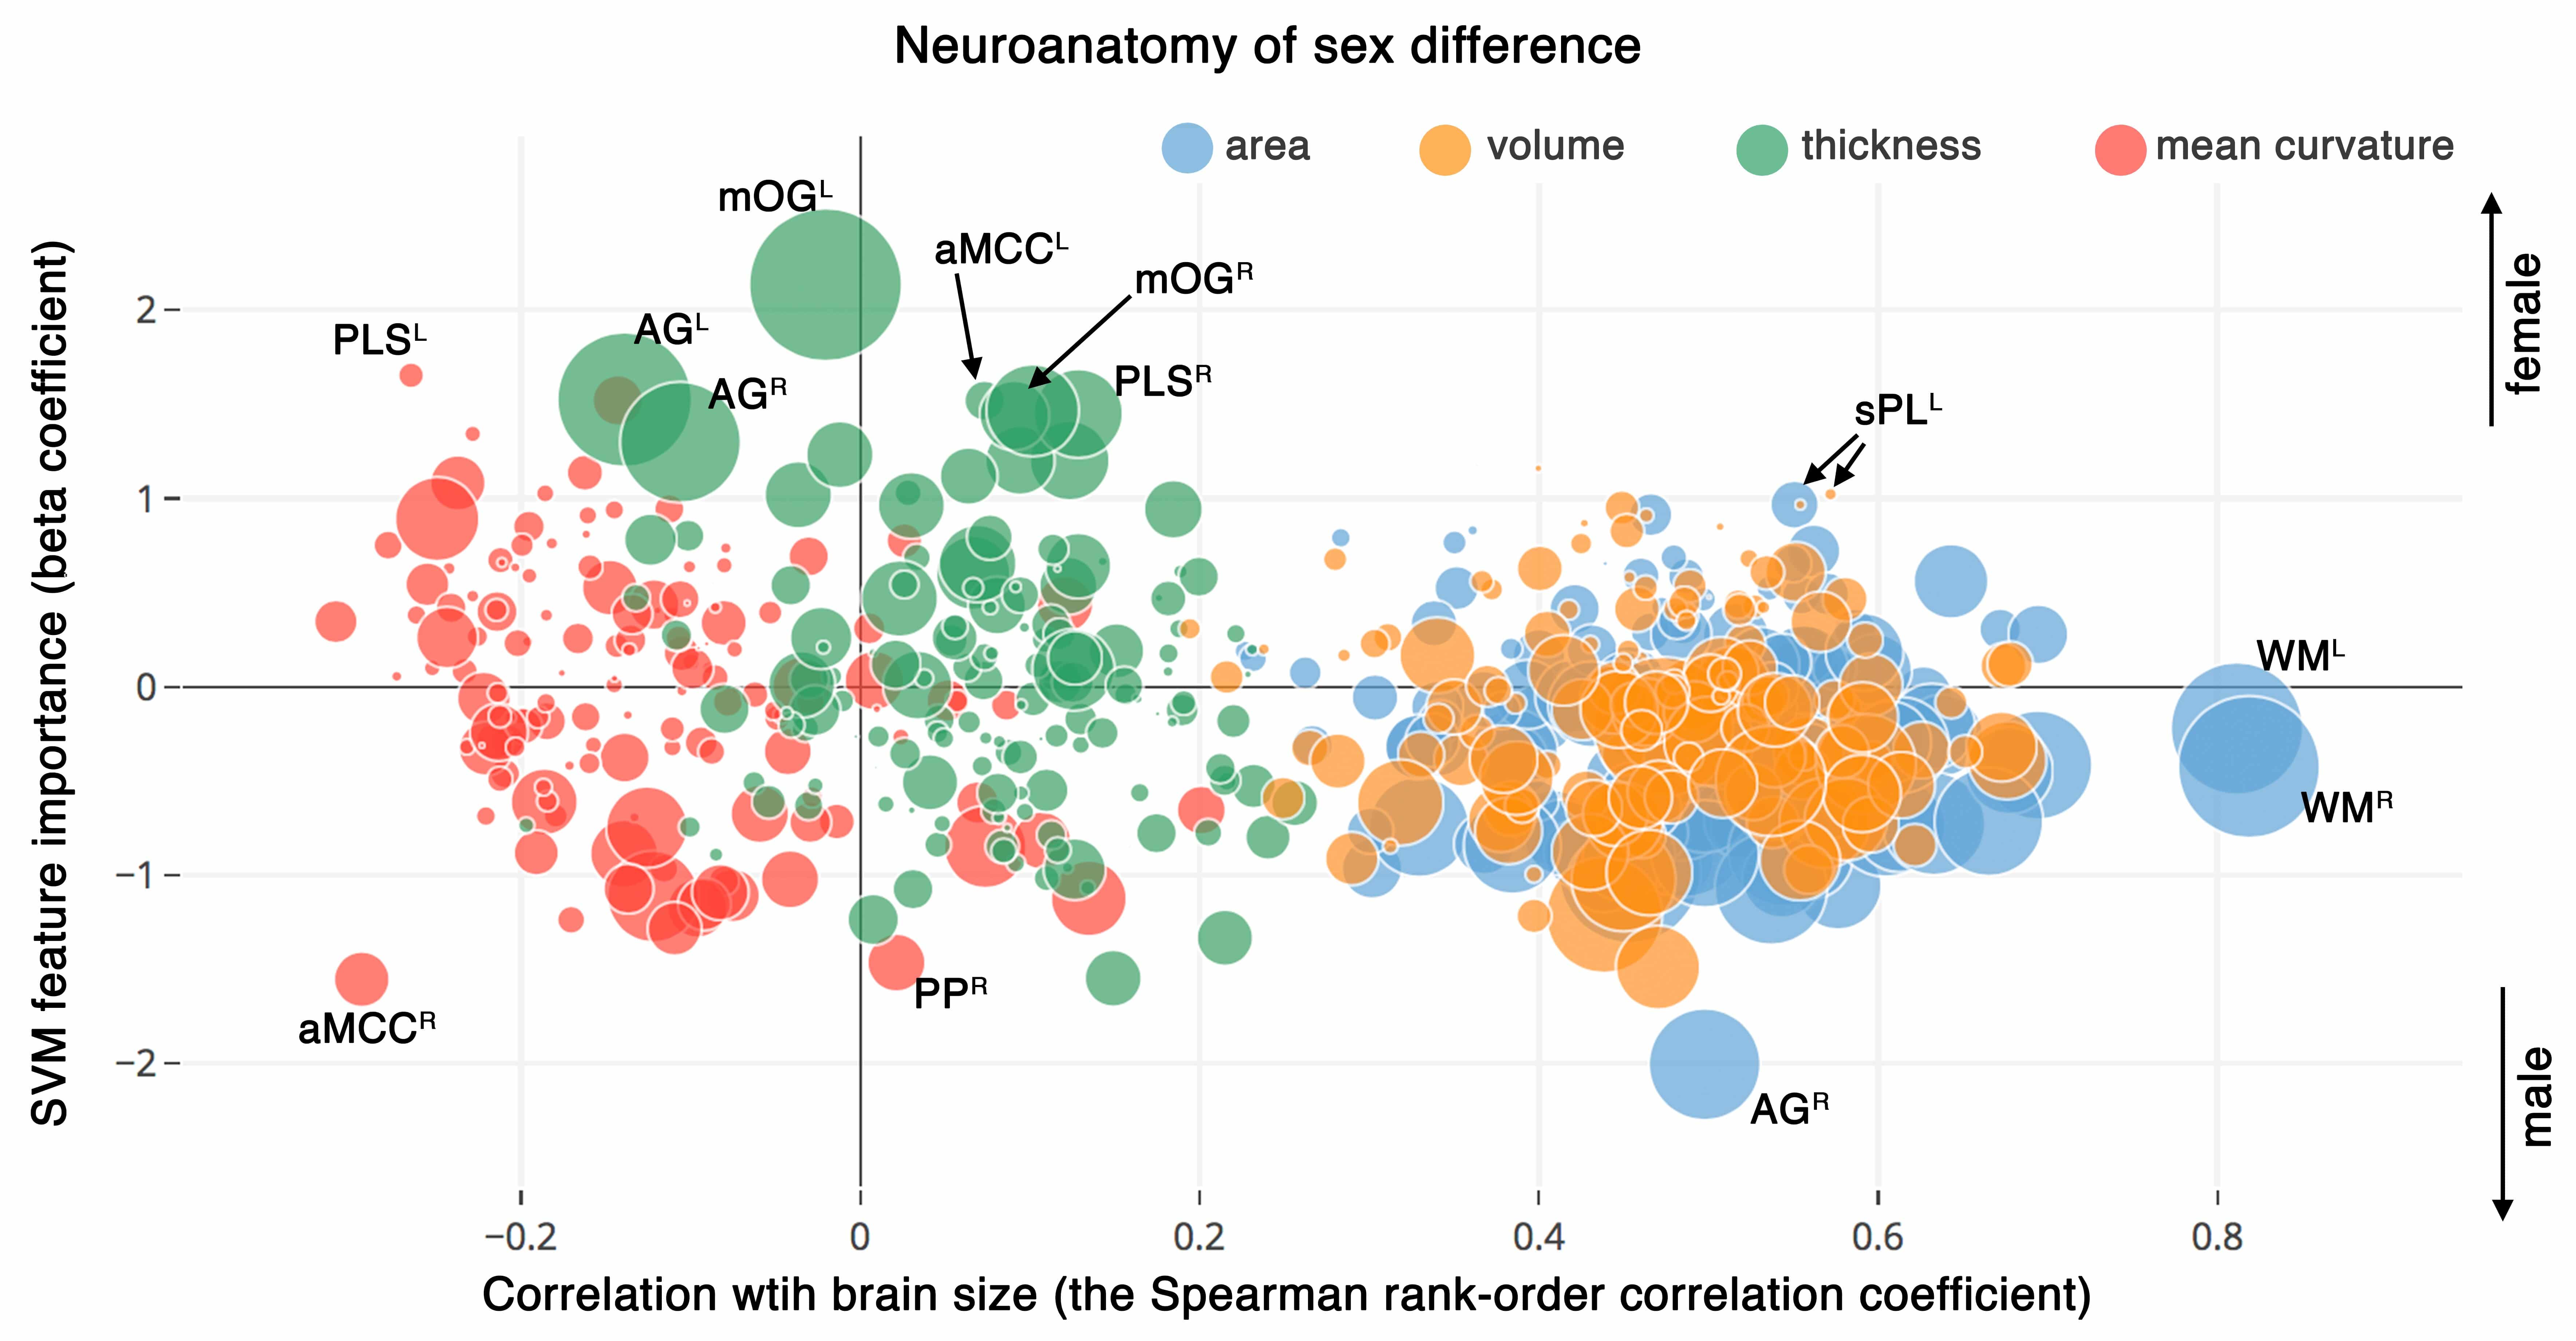
Visualization of neuroanatomical differences of sex by combining the following three statistical values: correlation of the neuroanatomical features with brain size as assessed by estimating Spearman’s correlation with estimated total intracranial volume (x-axis), sex-related discriminatory indices derived from the SVM model (y-axis), and the univariate sex-related differences obtained from the GLM analysis (radius of spheres = negative log of the p-value). PLS: Paracentral lobule and sulcus , aMCC: middle-anterior part of the cingulate cortex, mOG: medial occipital gyrus, AG: angular gyrus, PP: Planum polare of the superior temporal gyrus , sPL: superior parietal lobe, WM: white matter hemisphere. Superscripts refers to left (L), right (R) hemispheres. Interactive version of the plot is presented online on the Plotly website (https://plot.ly/~sepehrband/50/neuroanatomy-of-sex-difference/).
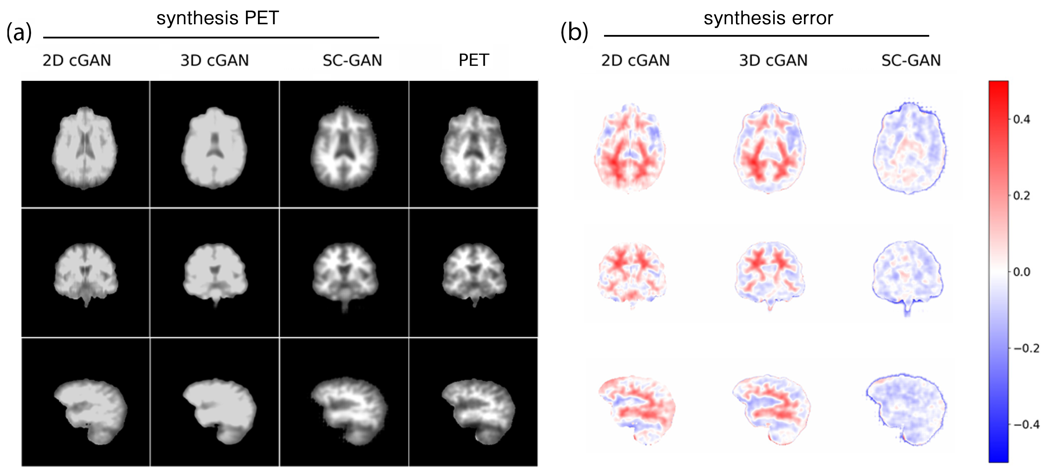
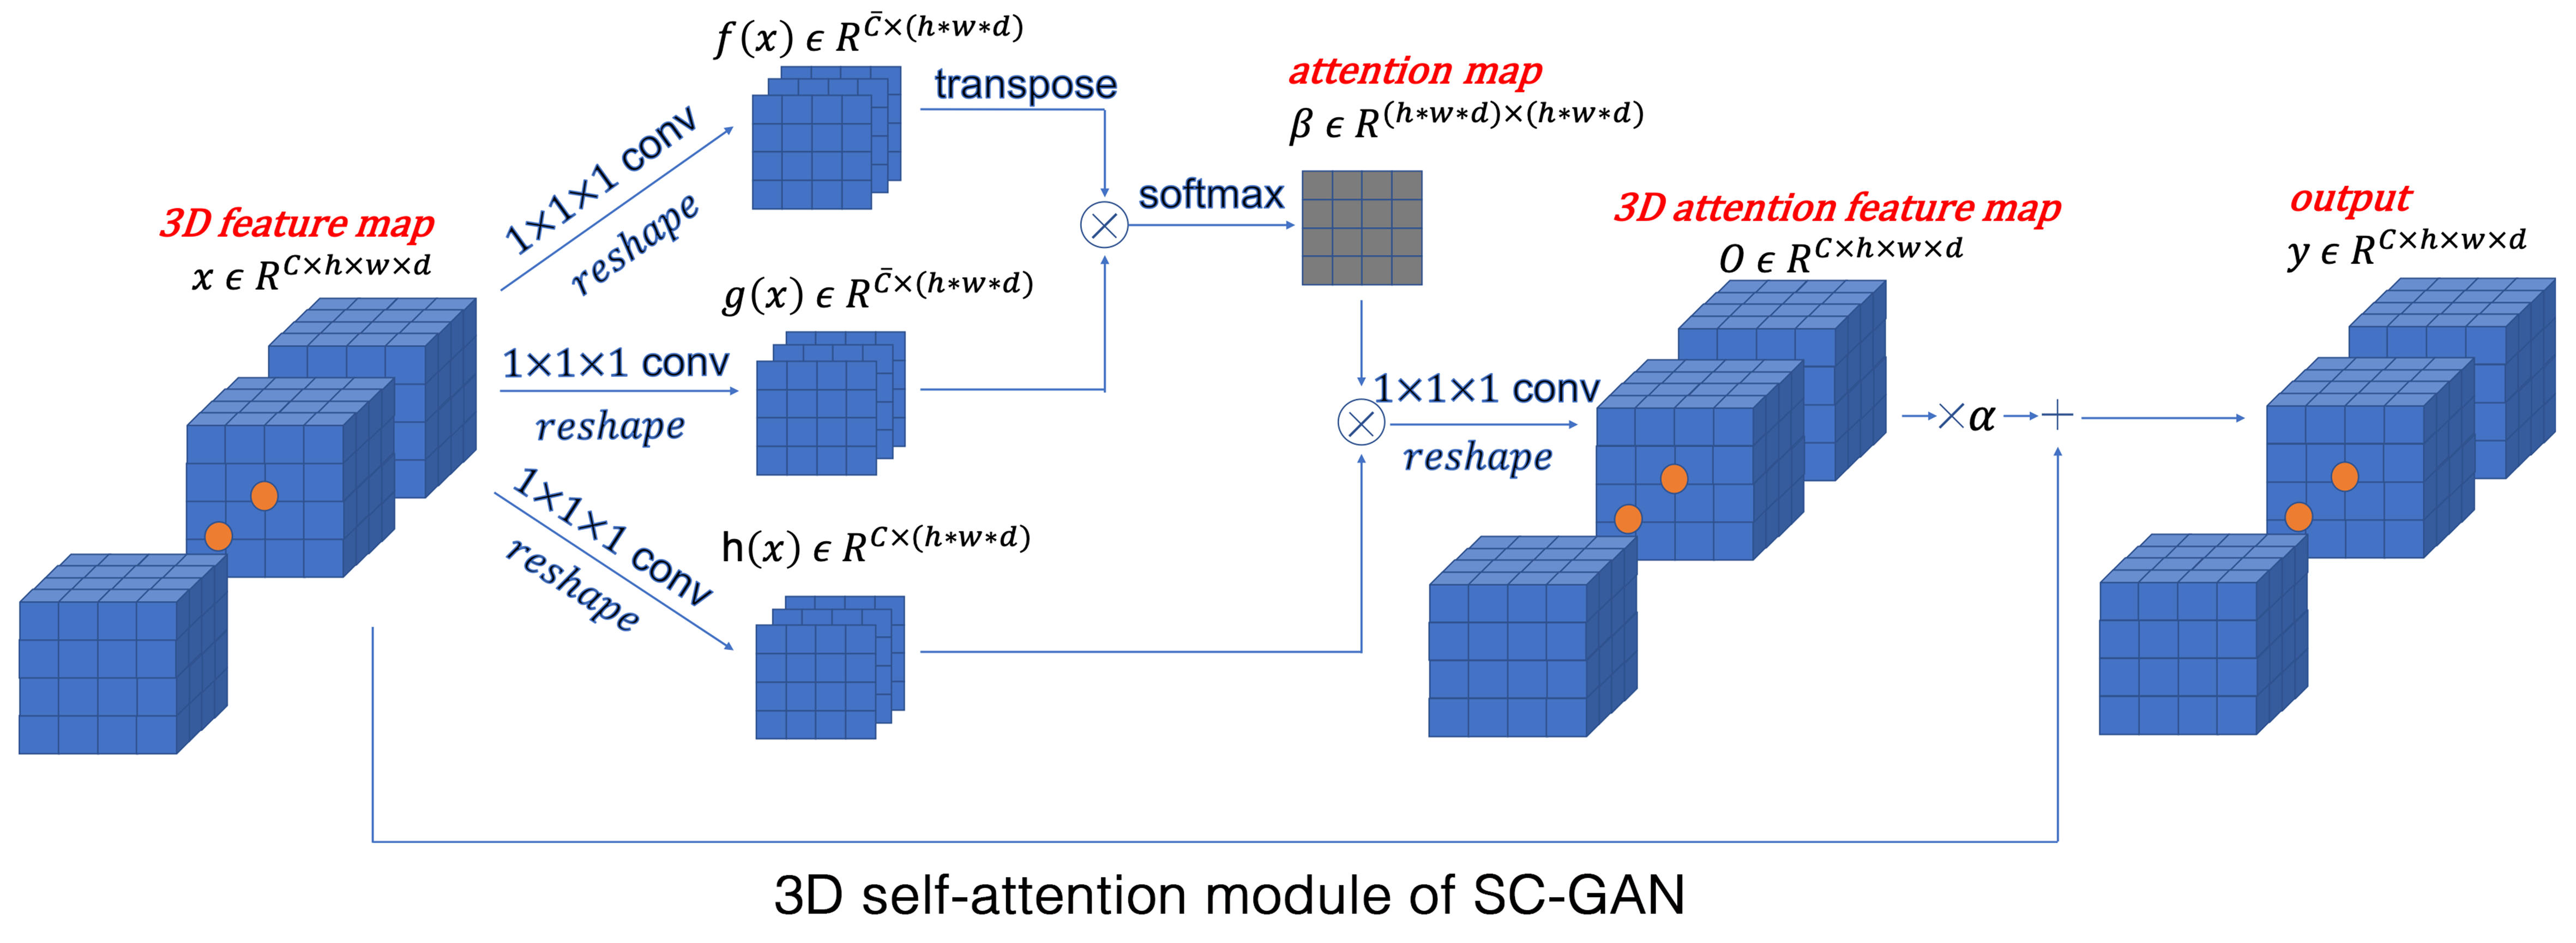
Image synthesis is one of the key applications of deep learning in neuroimaging, which enables to shorten the scan time and/or improve image quality; therefore, reducing the imaging cost and improving patient experience. Given the multi-modal and large-scale nature of the 3D neuro images, the synthesis task is challenging. Existing 2D networks do not take advantage of multi-dimensional spatial information and the 3D implementation has dimensionality problem, negatively affecting the network reliability. These limitations hinder the research and clinical applicability of deep learning-based neuroimaging synthesis. We proposed a new network that is designed and optimized for the application of multi-modal 3D synthesis of neuroimaging data. The network is based on 3D conditional generalized adversarial network (GAN), and employs spectral normalization and feature matching to stabilize the training process and ensure optimization convergence. We also added a self-attention module to model relationships between widely separated voxels. The performance of the network was evaluated by predicting positron emission tomography (PET) images from multi-modal magnetic resonance images (MRI) of over 300 individuals, which resulted to an average normalized root-mean-square error of 0.08. We found that our network, called self-attention conditional GAN (SC-GAN), significantly outperformed conventional 2D conditional GAN and the 3D implementation, enabling robust 3D deep learning-based neuroimaging synthesis.
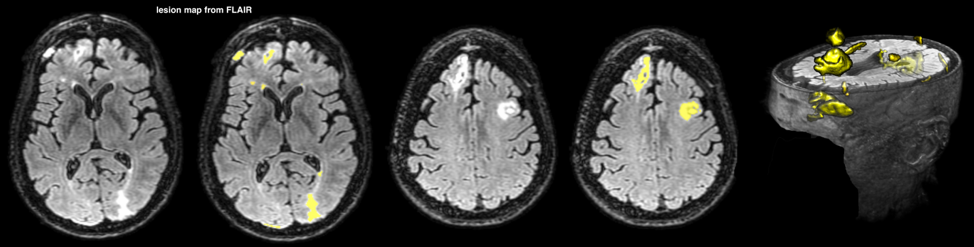
FLAIR suppresses the signal produced by CSF and is sensitive contrast for mapping lesions in TBI. FLAIR The pipeline starts with skull stripping, smoothing and intensity normalization. Then, lesions were separated from brain tissue and CSF using a histogram-based thresholding algorithm. Finally, lesions not overlapping with WM were discarded, by registering a WM mask from a standard space into the subject space (FSL-FNIRT was used for the registration). In order to separate periventricular WM hyperintensities from the rest of WM lesions, we performed a secondary analysis on the T1w images. T1w images are less sensitive to periventricular lesions due to CSF partial volume effect, yet it could visualize WM lesions across brain. T1w images were gone through a similar pipeline as FLAIR images, and the lesions were mapped accordingly.